
Exponential and Logarithmic Functions by Robert Laurie
Loading the math board and drawing, please wait…
In collections
Exponents and Logarithms
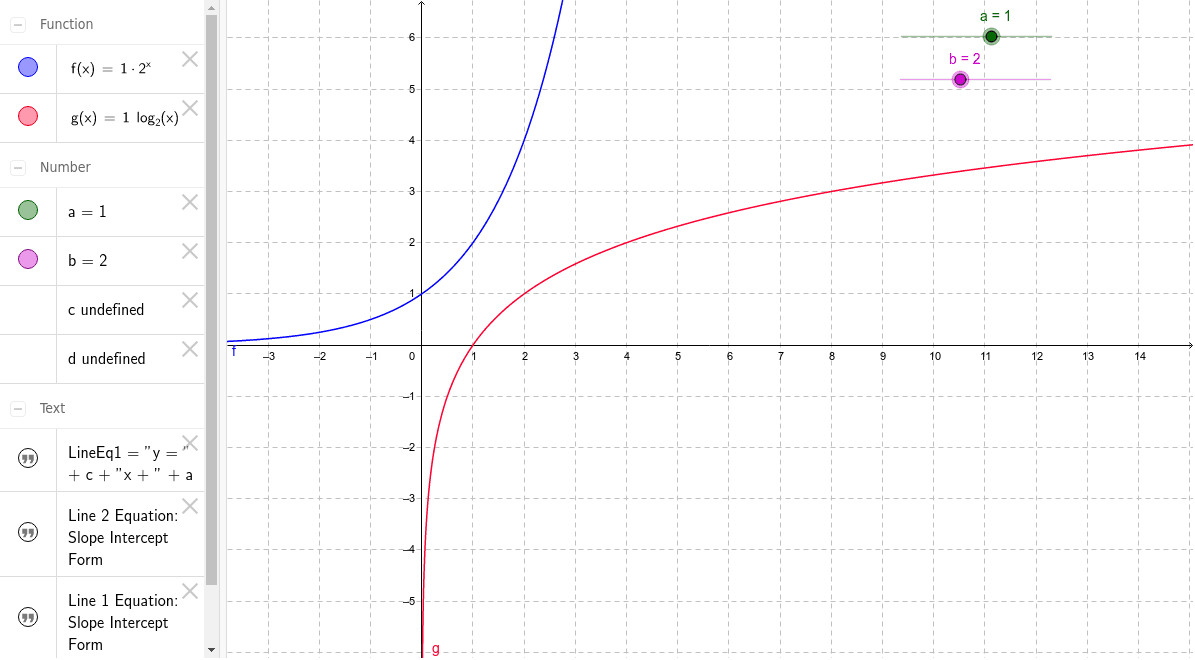
This example demonstrates the graphs of exponential and logarithmic functions. Key mathematical concepts include exponential growth, logarithmic relationships, and function transformations. Construction involves GeoGebra commands such as LineEq1, f, and g. Suitable for high school mathematics teaching or function graph analysis.
GeoGebra Commands & Parameters
Numeric c(NaN)Numeric a(1.0)Numeric d(NaN)Numeric b(2.0)f(x) = (a * b^(x))g(x) = (a * log(b, x))
AI Drawing Prompt Reference
Draw the graphs of exponential and logarithmic functions. The exponential function f(x) = a * b^x and the logarithmic function g(x) = a * log(b, x) should be shown on a coordinate system. The exponential function shows growth trends, and the logarithmic function shows logarithmic relationships. Both should be based on the same parameters a and b. The graph should clearly display the function curves and axes.
The prompt above was compiled from the original drawing commands and is for reference only.