
Exploring y=mx+b with Sliders
Loading the math board and drawing, please wait…
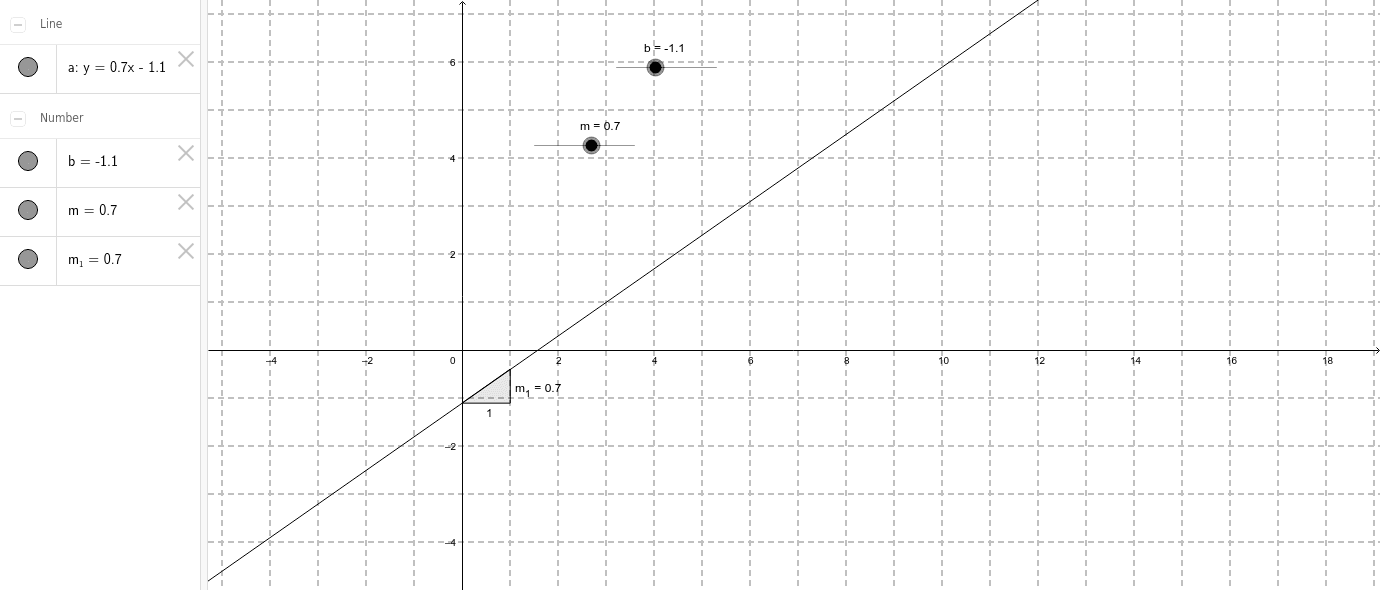
① This GeoGebra example demonstrates how the graph of a linear function y=mx+b changes as the slope m and y-intercept b are adjusted using interactive sliders. ② It covers core concepts of linear equations, including the geometric meaning of slope and intercept, and how parameter variations affect the line's steepness and vertical position. ③ The construction uses the Slope command to compute and display the slope, and creates objects m, b, a, and m_1 as sliders or auxiliary elements, allowing real-time updates of the equation and graph. ④ It is suitable for middle and high school students learning linear functions and introductory coordinate geometry, and serves as an effective tool for classroom demonstrations or self-directed exploration to build intuition about parameter-graph relationships.
GeoGebra Commands & Parameters
Slope(a) → m_1
AI Drawing Prompt Reference
Draw a line with the equation y=mx+b, where m and b are adjustable sliders. First, create a slider for the slope m, then create a slider for the y-intercept b. Use the value of m to calculate the slope of the line and display it. Finally, draw the line y=mx+b based on the values of m and b, and update the line's position and steepness in real time.
The prompt above was compiled from the original drawing commands and is for reference only.