
Exploring the Mean Value Theorem by MrQuinn
Loading the math board and drawing, please wait…
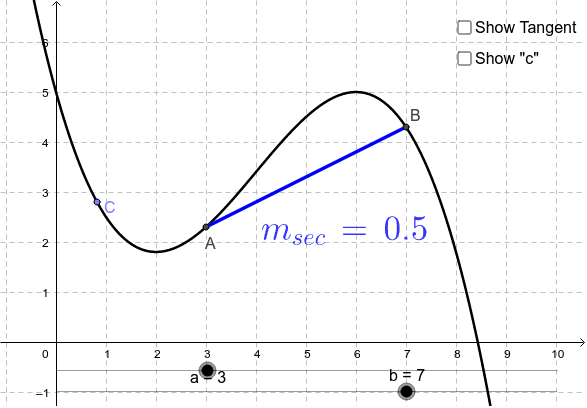
This example demonstrates the geometric meaning of the Mean Value Theorem for functions over a closed interval. Core math concepts include functions, derivatives, tangent and secant slopes. Construction highlights involve commands like Segment, Point, Tangent, Slope, LaTeX to draw the function f, interval endpoints a and b, points A and B, secant, tangent, tangent slope m_tan, secant slope m_sec, text annotations, and auxiliary points C, c, d, e. Suitable for high school and above students learning calculus to visually understand the theorem.
GeoGebra Commands & Parameters
Segment(A, B) → SecantPoint(f) → CTangent(C, f) → TangentSlope(Tangent) → m_{tan}Slope(Secant) → m_{sec}LaTeX(m_{sec}, true, true) → text1LaTeX(m_{tan}, true, true) → text2LaTeX(c, true, true) → text3
AI Drawing Prompt Reference
Draw a function graph and mark its interval endpoints, connecting them to form a secant line. Take a point on the function, draw a tangent line through this point, and calculate the slopes of both the secant and the tangent. Label the slopes of the secant and tangent lines, and also label the x-coordinate of the point on the function. Use these elements to illustrate the relationship between the slopes of the secant and tangent lines over the interval, demonstrating the geometric meaning of the Mean Value Theorem.
The prompt above was compiled from the original drawing commands and is for reference only.