
Exploring Ratios in a Geometric Sequence Graph
Loading the math board and drawing, please wait…
In collections
Grade 12 PreCalculus BC
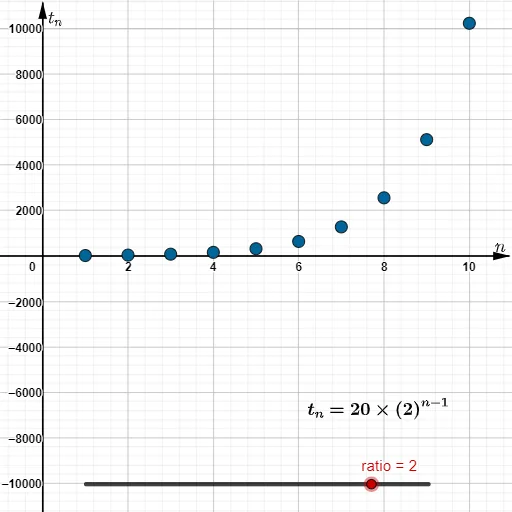
This example demonstrates how to visualize and explore the pattern of a geometric sequence by focusing on the ratio between terms and showing how key quantities shape the resulting graph. The main mathematical ideas include geometric sequences (Geometric Sequence), the adjacent-term ratio (ratio), and the emergence of curve behavior (often comparable to hyperbola-like relationships when parameterized). Construction-wise, it leverages GeoGebra commands such as Corner, Max, If, and Sequence to generate sequence data, apply conditional logic, and compute/track extrema. It also uses objects like ratio, dims, xmin, xmax, ymin, ymax to control plotting ranges and layout; additionally, max, text1, text2, and l1 support labeling and displaying results tied to the computed ratio and constraints. Suitable for upper secondary and introductory college use in teaching sequences, function graphing, and computational verification.
GeoGebra Commands & Parameters
Corner(5) → dimsMax((20 * abs(ratio)^(9)), 20) → maxIf(max > 0, (1.1 * max), (-1.1 * max)) → ymaxIf(max > 0, (-1.1 * max), (1.1 * max)) → yminSequence((m, (20 * ratio^(m - 1))), m, 1, 10) → l1
AI Drawing Prompt Reference
Draw a graph representing a geometric sequence, highlighting the ratio between consecutive terms and showing how this ratio influences the curve shape. Start by establishing a reference point, then calculate each term of the sequence based on the ratio and plot the points. Adjust the visible range of the graph based on the maximum value of the sequence to ensure all points are visible. Finally, label the graph with the ratio between consecutive terms and the key range values.
The prompt above was compiled from the original drawing commands and is for reference only.