
Exploring Ranges of Line Segments
Loading the math board and drawing, please wait…
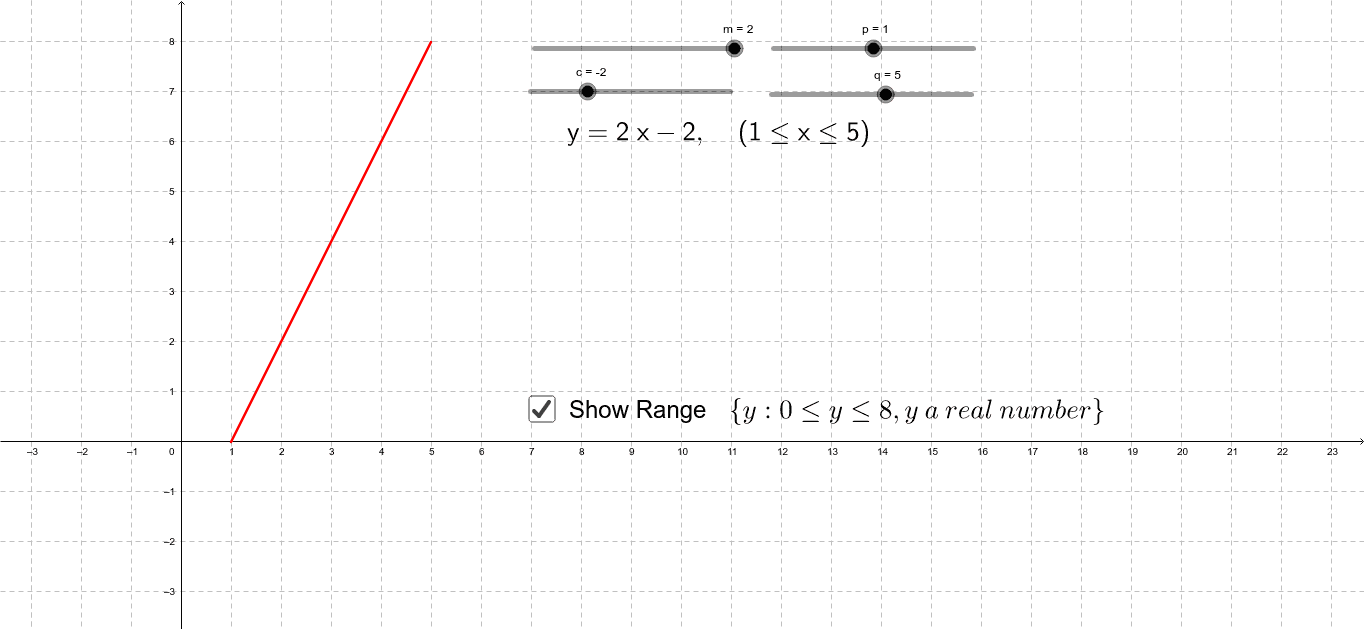
This example demonstrates how to investigate the range of straight line graph segments using GeoGebra. It involves core math concepts like line segments, piecewise functions, distributions, random experiments, symmetry, and fractions. The construction utilizes GeoGebra commands and objects such as Intersect, Max, Min, and elements like m, c, p, q, b, d, C, D, f, text1, A, B, text4, c_1, text2. It is suitable for high school mathematics education, focusing on understanding the limits and key points of function graphs.
GeoGebra Commands & Parameters
Intersect(b, xAxis) → CIntersect(d, xAxis) → DMax(f, p, q) → AMin(f, p, q) → B