
Exploring Quadratic Functions by Cynthia Garland
Loading the math board and drawing, please wait…
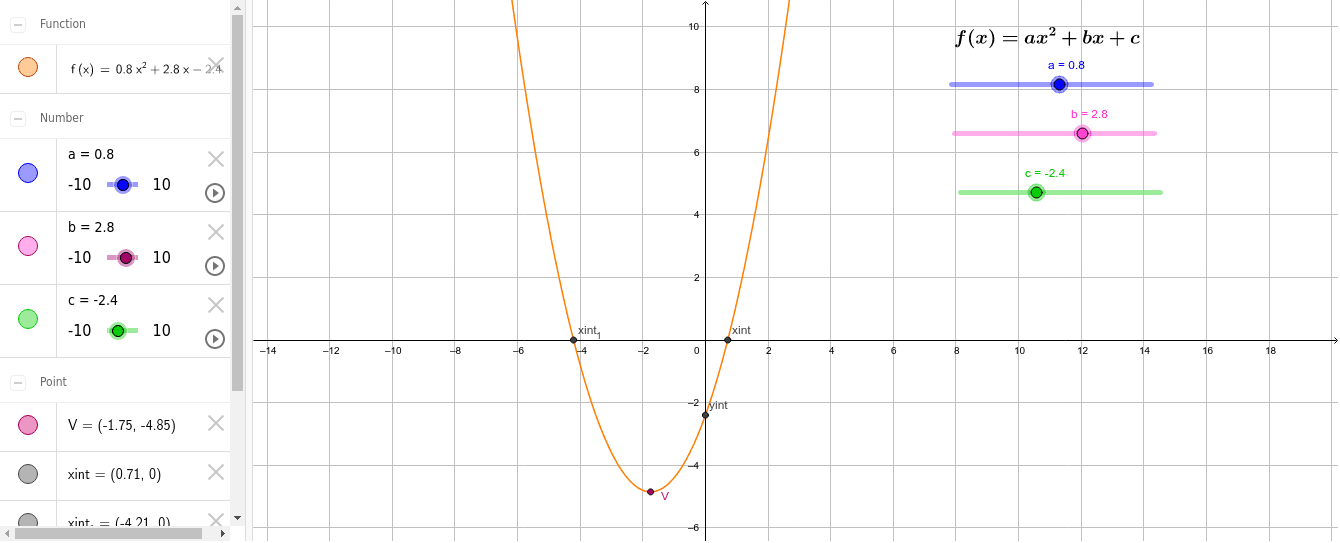
This example demonstrates the graph of a quadratic function f(x)=ax²+bx+c and how its variables interact with the graph. Key math concepts include quadratic functions, function graphs, vertex, axis of symmetry, and intersections with the x-axis and y-axis. It uses GeoGebra commands like Extremum (to find extremum points) and Intersect (to find intersections), with objects such as parameters a, b, c, function f, text1, point V, y-intercept yint, and x-intercepts xint_1, xint. Suitable for high school mathematics education to help students visually understand the impact of parameter changes on the function graph.
GeoGebra Commands & Parameters
Extremum(f) → VIntersect(f, yAxis, 1) → yintIntersect(f, xAxis, 1) → xint_1Intersect(f, xAxis, 2) → xint