
Exploring PV Diagrams: Linear Gas Process Simulation
Loading the math board and drawing, please wait…
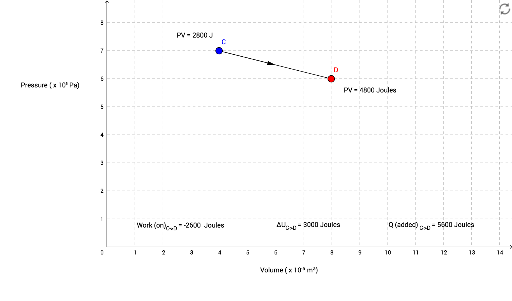
This example demonstrates a linear thermodynamic process on a Pressure-Volume (PV) diagram. Core concepts involve coordinate geometry, vectors, and parametric curves. Construction utilizes GeoGebra commands like Segment, Midpoint, and Vector to define states and paths, with text annotations for clarity. Ideal for high school physics or university thermodynamics students to visualize state changes and equations of state.
GeoGebra Commands & Parameters
Segment(C, D) → aMidpoint(a) → EVector(C, E) → u
AI Drawing Prompt Reference
Draw a linear thermodynamic process on a Pressure-Volume diagram, starting by creating a line segment between two points, finding its midpoint, and then drawing a vector from the starting point to the midpoint to illustrate the process and state changes clearly, with text annotations for explanation.
The prompt above was compiled from the original drawing commands and is for reference only.