
Exploring Probability with a Proportional Venn Diagram
Loading the math board and drawing, please wait…
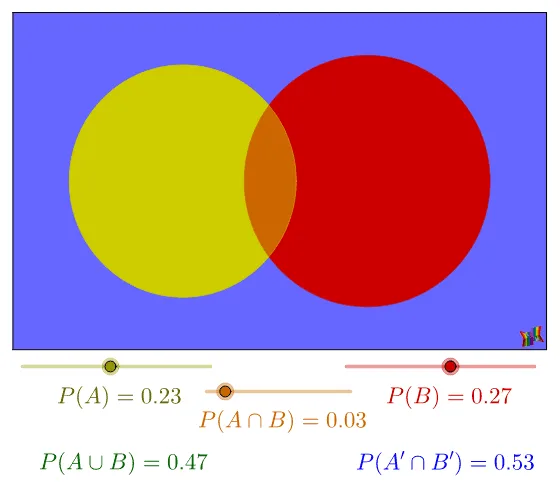
This GeoGebra example presents a Venn diagram with proportionally‑sized regions to visualize the probabilities of events A and B and their intersection. Users can directly adjust P(A), P(B) and P(A∈B) via sliders and see how the areas change accordingly. The underlying mathematics covers probability theory, set operations, and area‑proportional representation. The construction uses GeoGebra commands such as If, Circle, Polygon, Intersect, and CircleArc together with objects that define the circles, polygons and sliders. It is intended for high‑school or early‑college students studying probability and statistics, as well as for teachers creating interactive lessons.
GeoGebra Commands & Parameters
If(Min[aPA, aPB] ≟ 0.26 ∧ (abs(Max[aPA, aPB] - 0.28) ≤ 0.01) ∧ aPAnB ≟ 0.25, 0.4, If[(Min[aPA, aPB] - aPAnB ≤ 0.02) ∧ (aPAnB > 0.26), (abs(r_A - r_B) + Max[r_A, r_B]) / 5, Max[r_A, r_B]]) → startvalueIf(r_A + r_B + A6 ≥ 1.618^(0.5), 1.618^(0.5) - r_A - r_B, If[aPAnB ≟ Min[aPA, aPB], Max[r_A, r_B] - Min[r_A, r_B], If[aPAnB ≟ 0, r_A + r_B, A6]]) → separationxIf(r_A + r_B + A6 ≥ 1.618^(0.5), If[aPAnB ≟ 0, ((r_A + r_B)^(2) - separationx^(2))^(0.5), (A6^(2) - (1.618^(0.5) - r_A - r_B)^(2))^(0.5)], 0) → separationyIf(r_A + r_B + A6 ≥ 1.618^(0.5), (separationy - r_A + r_B) / 2, 0) → yACircle(A, r_A) → PACircleCircle(B, r_B) → PBCirclePolygon(C, D, E, F) → poly1, c, d, e, fCircle(A, r_A) → PACircle2Circle(A, r_A) → PAGreenCircleCircle(B, r_B) → PBGreenCircleIntersect(PACircle, PBCircle) → G, H, ,CircleArc(A, H, G) → gIf(aPA ≟ 0.2 ∧ aPB ≟ 0.2 ∨ aPA ≟ 0.19 ∧ aPB ≟ 0.19, 0, Cell[SScol, SSrow]) → aMinPAnB
AI Drawing Prompt Reference
Draw a probability Venn diagram with two overlapping circles representing events A and B. The areas of the circles should reflect probabilities P(A) and P(B), and the overlapping region should show their intersection. Users can adjust circle sizes and positions to observe changes. The diagram should clearly illustrate set relationships and area proportions, suitable for teaching or demonstration.
The prompt above was compiled from the original drawing commands and is for reference only.