
Exploring Parametric and Cartesian Equations
Loading the math board and drawing, please wait…
In collections
Properties of the Parabola
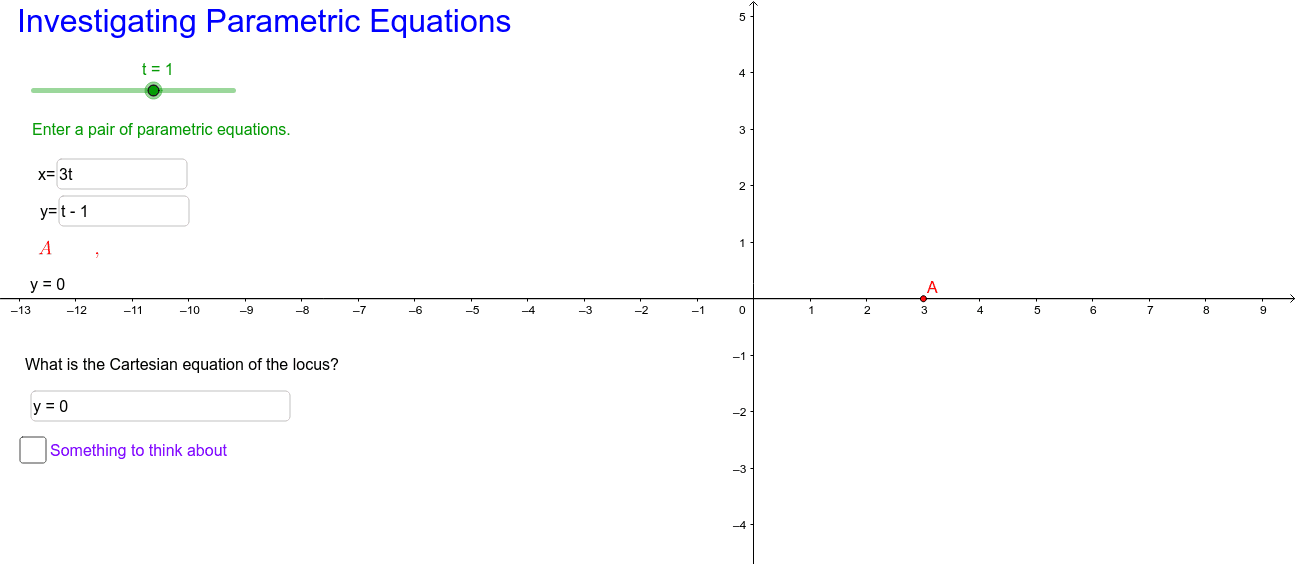
This example demonstrates how to visualize the relationship between parametric and Cartesian representations of curves. Key math concepts include parametric equations, coordinate geometry, and vectors. It is constructed using GeoGebra commands like Textfield, t, text1, text2, text4, h, inputBox1, f, g, inputBox4, inputBox5, A, text3, text5, a, making it suitable for high school mathematics education to help students understand the conversion and visualization between parametric and Cartesian equations.
GeoGebra Commands & Parameters
Textfield(h) → inputBox1Textfield(f) → inputBox4Textfield(g) → inputBox5
AI Drawing Prompt Reference
Create a visualization showing the relationship between parametric and Cartesian equations, including two input boxes for entering the parametric and Cartesian equations, and display the corresponding curves to help understand their conversion and visualization.
The prompt above was compiled from the original drawing commands and is for reference only.