
Exploring Linear Inequalities
Loading the math board and drawing, please wait…
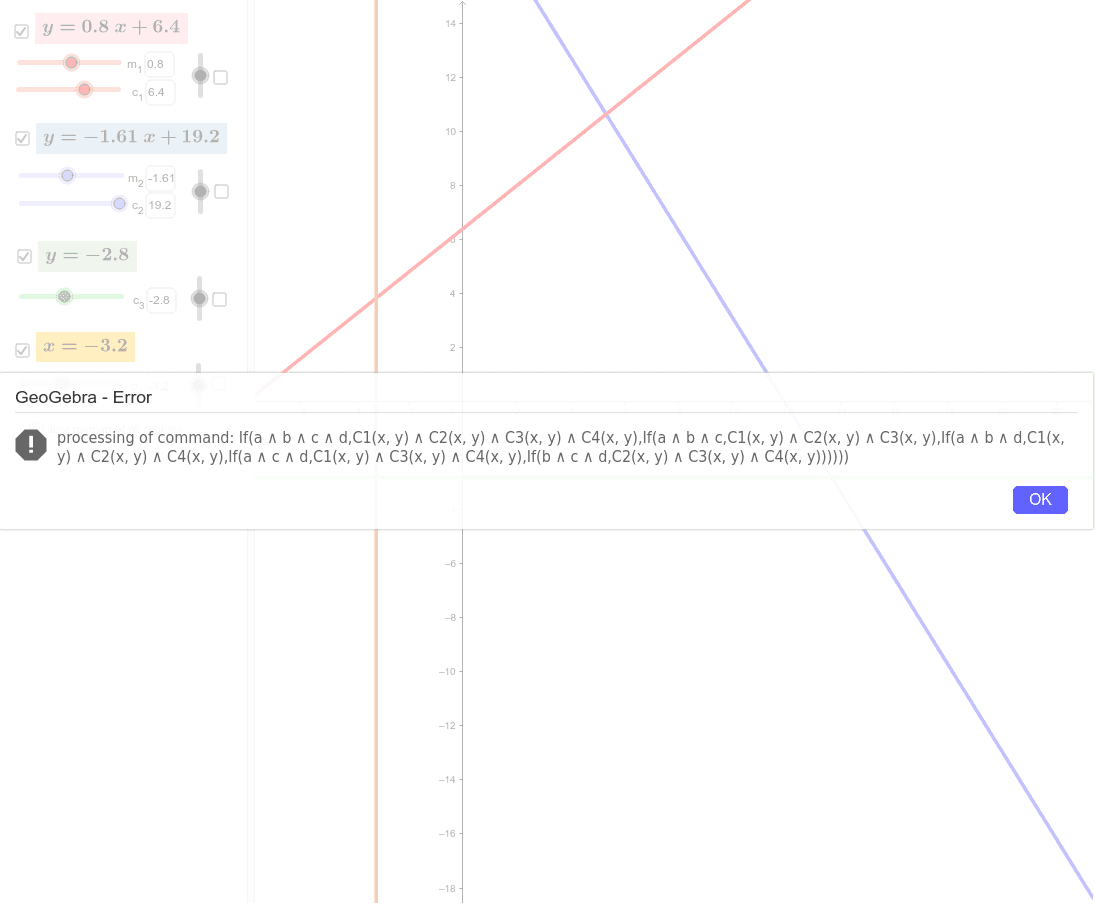
This example demonstrates linear inequalities using four lines, showing how regions are determined by linear boundaries. Key math concepts include linear inequalities, boundary lines, and region identification. GeoGebra commands like Textfield, If, and TextToUnicode are used with objects such as t_2, S_2, and inputBoxes for dynamic input and display. Suitable for high school mathematics education, focusing on the basics of linear programming and graphical representation of inequalities.
GeoGebra Commands & Parameters
Textfield(m_1) → inputBox1Textfield(c_1) → inputBox2Textfield(m_2) → inputBox3Textfield(c_2) → inputBox4If(S_1 ≟ 1, If[t_1, "≥", ">"], If[S_1 ≟ -1, If[t_1, "≤", "<"], "="]) → sgn_1If(S_1 ≟ 1, y > f_1(x), If[S_1 ≟ -1, y < f_1(x), y = f_1(x)]) → C1If(S_2 ≟ 1, If[t_2, "≥", ">"], If[S_2 ≟ -1, If[t_2, "≤", "<"], "="]) → sgn_2If(S_2 ≟ 1, y > f_2(x), If[S_2 ≟ -1, y < f_2(x), y = f_2(x)]) → C2Textfield(c_3) → inputBox5If(S_3 ≟ 1, y > (0 * x) + c_3, If[S_3 ≟ -1, y < (0 * x) + c_3, y = (0 * x) + c_3]) → C3If(S_3 ≟ 1, If[t_3, "≥", ">"], If[S_3 ≟ -1, If[t_3, "≤", "<"], "="]) → sgn_3Textfield(d_1) → inputBox6If(S_4 ≟ 1, x > (0 * y) + d_1, If[S_4 ≟ -1, x < (0 * y) + d_1, x = (0 * y) + d_1]) → C4If(S_4 ≟ 1, If[t_4, "≥", ">"], If[S_4 ≟ -1, If[t_4, "≤", "<"], "="]) → sgn_4Textfield(m_1) → inputBox1_1Textfield(c_1) → inputBox2_1TextToUnicode("≤") → qTextfield(m_2) → inputBox3_1Textfield(c_2) → inputBox4_1If(a ∧ b ∧ c ∧ d, C1(x, y) ∧ C2(x, y) ∧ C3(x, y) ∧ C4(x, y), If[a ∧ b ∧ c, C1(x, y) ∧ C2(x, y) ∧ C3(x, y), If[a ∧ b ∧ d, C1(x, y) ∧ C2(x, y) ∧ C4(x, y), If[a ∧ c ∧ d, C1(x, y) ∧ C3(x, y) ∧ C4(x, y), If[b ∧ c ∧ d, C2(x, y) ∧ C3(x, y) ∧ C4(x, y)]]]]) → OverlapOfAll
AI Drawing Prompt Reference
Draw two lines y = m1x + c1 and y = m2x + c2 using input boxes 1 and 2 for m1 and c1, and input boxes 3 and 4 for m2 and c2. Then draw a horizontal line y = c3 using input box 5 and a vertical line x = d1 using input box 6. Based on the selections in input boxes 7, 8, 9, and 10, determine the inequality symbols (≥, >, ≤, <) for each line and indicate the region that satisfies all inequalities.
The prompt above was compiled from the original drawing commands and is for reference only.