
Exploring Fractions and Functions
Loading the math board and drawing, please wait…
In collections
Fractions الكسور
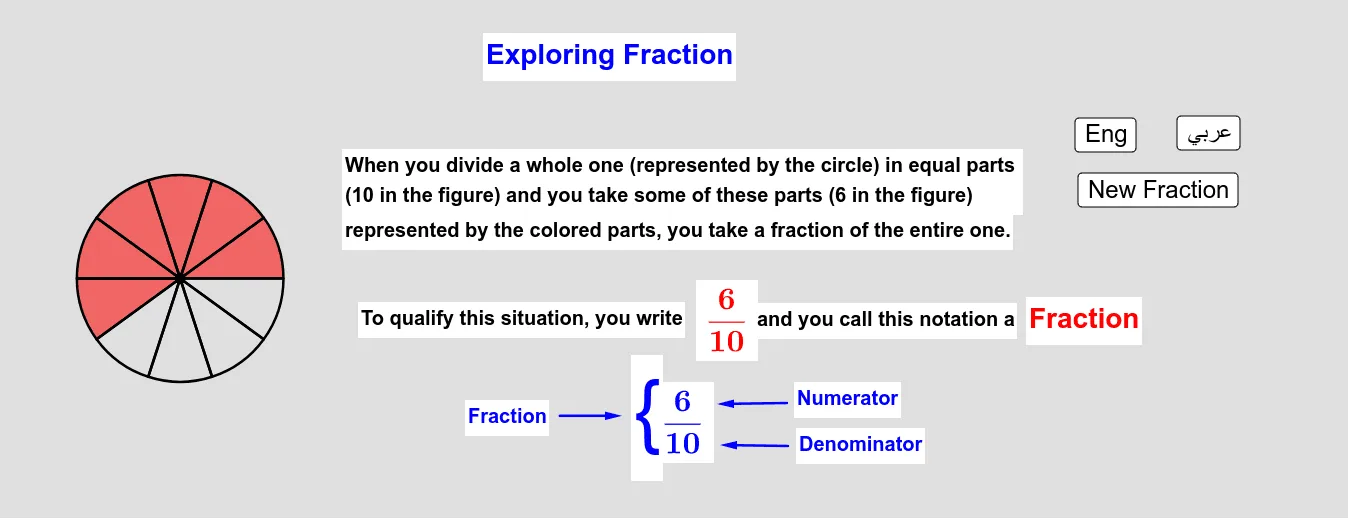
This example demonstrates fractions, exponential functions, median values, and scatter plots through interactive visualization. Key math concepts include fractions, exponential functions, median values, slope differences, and scatter plots. Constructed using GeoGebra commands like Random, Append, Circle, Sequence, and Vector. Suitable for high school mathematics education, focusing on data analysis and function graphs.
GeoGebra Commands & Parameters
Random(2, 10) → nAppend(A, Sequence[Rotate[A, ((k * 2) * π / n), O], k, 1, n]) → PointsCircle(O, 3) → cRandom(1, n - 1) → mSequence(Sector[c, Element[Points, k], Element[Points, k + 1]], k, 1, m) → PartSectorsSequence(Sector[c, Element[Points, k], Element[Points, k + 1]], k, 1, n) → AllSectorsVector(B, C) → uVector(D, E) → vVector(F, G) → w