
Exploring Exponential vs. Linear Functions
Loading the math board and drawing, please wait…
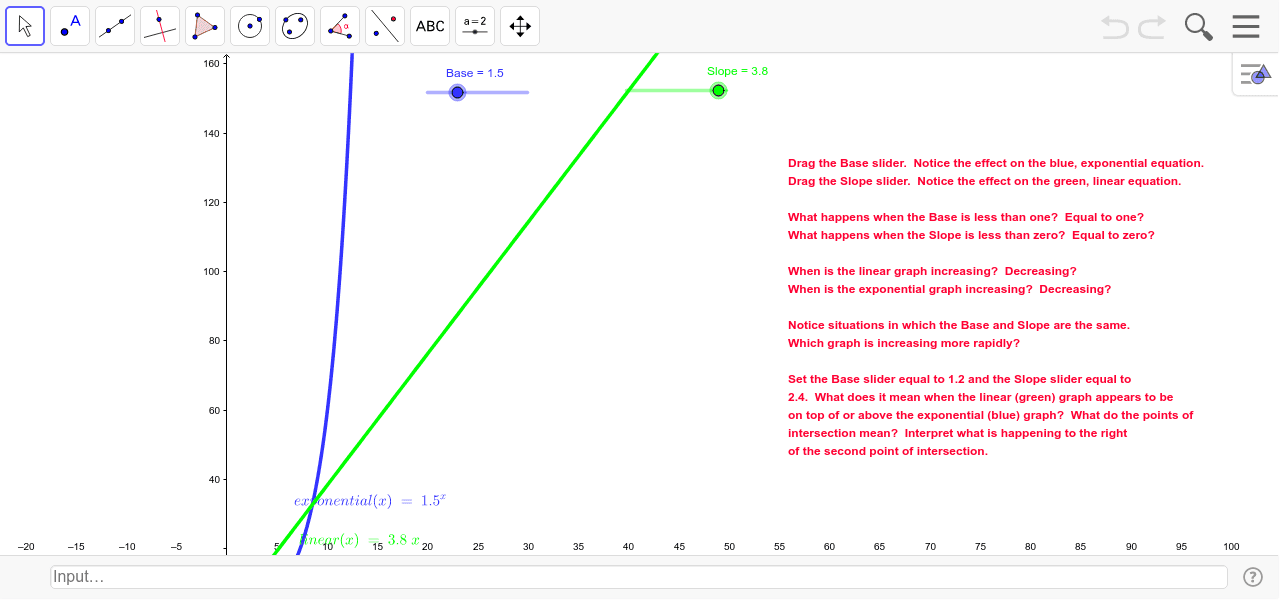
This sketch uses sliders to help students explore linear relationships versus exponential ones. ① It visually demonstrates the distinct shapes of linear functions (constant rate of change) and exponential functions (constant multiplicative factor). ② The core mathematical concepts include the definition of a function, slope, exponentiation, and graphing functions on a coordinate plane. ③ The construction employs GeoGebra objects such as Base, exponential, Slope, linear, and text1, with sliders that dynamically adjust parameters to update the graphs in real time. ④ It is suitable for middle‑school and high‑school learners and for teachers creating interactive lessons on function behavior.
GeoGebra Commands & Parameters
Numeric Base(1.5)exponential(x) = Base^(x)Numeric Slope(3.8)linear(x) = Slope * x
AI Drawing Prompt Reference
Draw an exponential curve and a straight line on a coordinate plane, each controlled by an adjustable slider. First create two numeric sliders: one for the base of the exponential function (starting around 1.5) and one for the slope of the linear function (starting around 3.8). Then define the exponential function y = base^x and the linear function y = slope·x using the slider values, and display both graphs simultaneously in the same axes so their growth behaviors can be compared.
The prompt above was compiled from the original drawing commands and is for reference only.