
Exploring Exponential Functions: Graphs and Properties
Loading the math board and drawing, please wait…
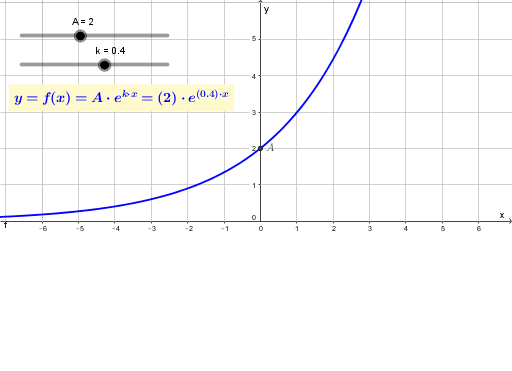
①This GeoGebra example dynamically illustrates the graph of an exponential function y=a^x, showing how the curve changes as the base a varies, revealing growth or decay behavior. ②Core mathematical concepts include the definition of exponential functions, monotonicity, the fixed point (0,1), and how the base affects the range and shape of the graph, along with comparisons to power functions. ③Construction highlights: using GeoGebra objects such as A (likely a point or parameter), k (base or coefficient), f (function expression), B (auxiliary point), and text1 (text label) to build an interactive visualization, allowing parameter adjustment via sliders or input fields for real-time observation. ④Suitable for high school students learning exponential functions, as well as introductory calculus in college, helping to intuitively grasp exponential growth/decay and the connection between algebraic expressions and their graphical representations.
GeoGebra Commands & Parameters
Numeric A(2.0)Numeric k(0.4)f(x) = (A * ℯ^((k * x)))(0, A)
AI Drawing Prompt Reference
Draw the graph of an exponential function y=a^x, where a is the base. Set a to 2 initially and allow it to slide between 0.1 and 5. Plot the function y=a^x and mark the point (0,1) when x=0.
The prompt above was compiled from the original drawing commands and is for reference only.