
Exploring Equations of Lines: Visualizing Slope and Intercept
Loading the math board and drawing, please wait…
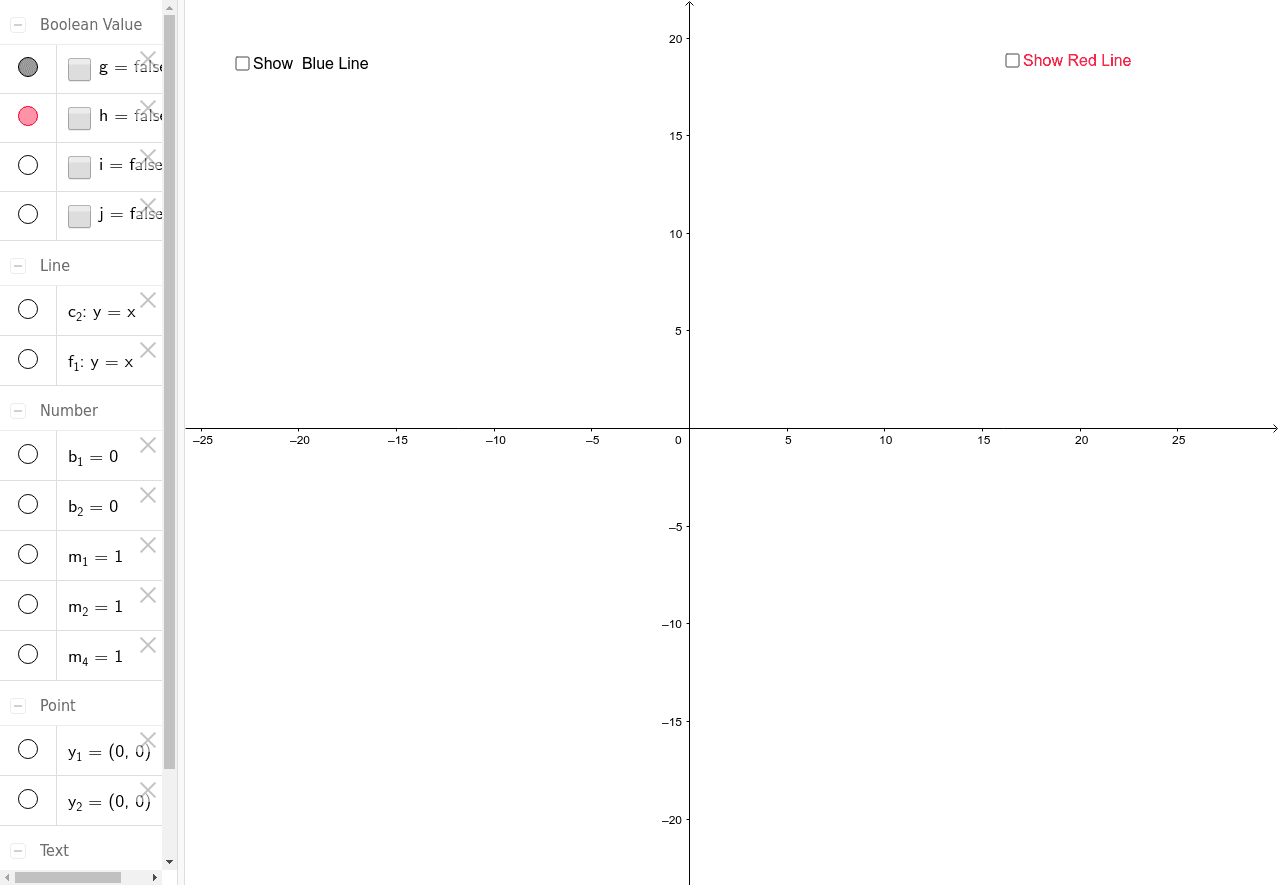
① This interactive GeoGebra example uses draggable sliders to demonstrate how changing the slope m and y-intercept b in the linear equation y = mx + b affects the position and steepness of a line on a Cartesian coordinate system. ② Core mathematical concepts include linear functions, slope, y-intercept, intersections with axes, and the effect of parameter variation on function graphs. ③ Construction highlights: the Slope command is used to compute and display the slope, while the Intersect command finds the line's intersections with the coordinate axes; the construction involves multiple objects (e.g., b_2, m_2, b_1, c_2, m_1, m_4, g, h, i, j, f_1, text2, text1, y_1, y_2) where sliders control m and b, and dynamic text displays the current equation and values. ④ Suitable for middle school to high school students learning properties of linear functions, and for teachers demonstrating or students exploring the visual connection between parameters and graphs.
GeoGebra Commands & Parameters
Slope(c_2) → m_4Intersect(yAxis, f_1) → y_1Intersect(yAxis, c_2) → y_2
AI Drawing Prompt Reference
Draw a line in a Cartesian coordinate system with draggable sliders to control its slope and y-intercept, showing how changes affect the line's position and steepness. Display the current equation and parameter values dynamically, and mark the intersections of the line with the x-axis and y-axis.
The prompt above was compiled from the original drawing commands and is for reference only.