
Exploring Distance-Speed Relationship
Loading the math board and drawing, please wait…
In collections
CCSS Support Math II Unit 2
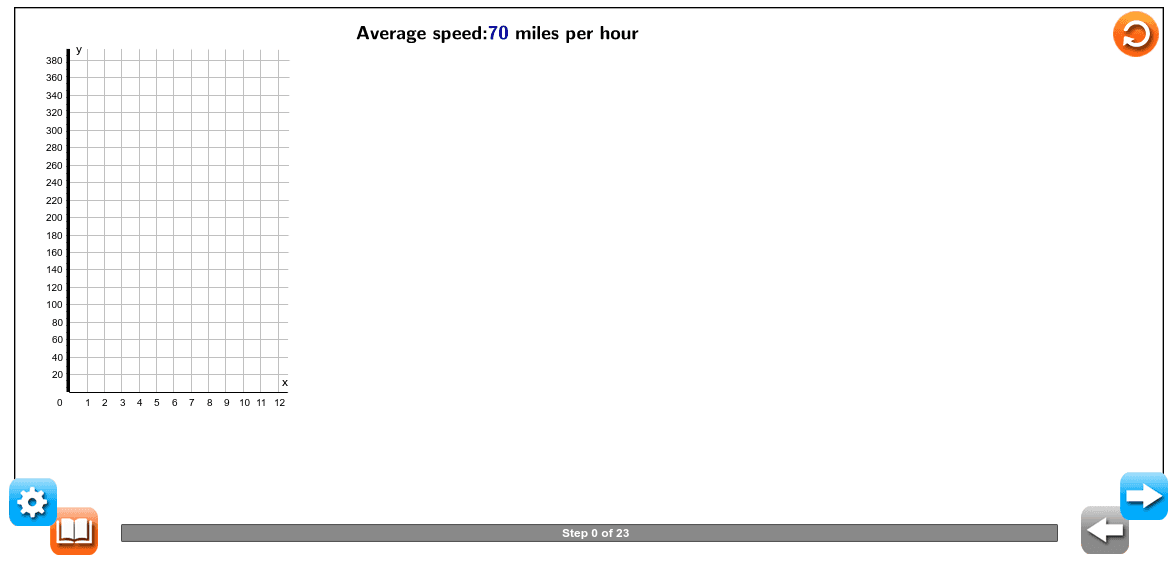
This example demonstrates the mathematical model of the relationship between driving distance and speed. It involves core concepts like functions, speed, distance, and integral calculus. Constructed using GeoGebra commands and objects such as Polygon, LaTeX, VerticalText, Vector, and TableText. Suitable for high school and above students to learn and understand the connection between function graphs and real-world applications.
GeoGebra Commands & Parameters
Polygon(A, B, C, D) → PolyTop, a, b, c, dPolygon(E, F, G, H) → PolyRight, e, f, g, hLaTeX("\text{Identify the independent and dependent quantities.}") → Pg1ALaTeX("\text{that Eric traveled depends on the time in hours that he spent driving.}") → Pg1CLaTeX("\text{Choose variables to represent the independent and dependent quantities.}") → Pg1ELaTeX("\text{by the variable \textcolor{#000099}{t}.}") → Pg1GLaTeX("\text{by the variable \textcolor{#000099}{d}.}") → Pg1ILaTeX("\text{Write an equation to represent the relationship between the independent and dependent variables.}") → Pg1JLaTeX("\text{The distance in miles (\textcolor{#000099}{d}) that Eric traveled is calculated by multiplying his rate}") → Pg1KLaTeX((("\text{(\textcolor{#000099}{" * MPH) * "} miles per hour) by the time in hours (\textcolor{#000099}{t}) that he spent driving.}")) → Pg1LLaTeX("\text{Create a table to represent the relationship between the independent and dependent variables.}") → Pg2ALaTeX("\text{hours (\textcolor{#000099}{t}).}") → Pg2CLaTeX("\text{Use the table to create a graph that represents the relationship between the independent}") → Pg3ALaTeX("\text{and dependent variables.}") → Pg3BLaTeX("\text{coordinate plane.}") → Pg3DLaTeX("\text{Each row in the table of values provides a coordinate point that can be graphed on the}") → Pg3JLaTeX("\text{the coordinate plane to represent the relationship.}") → Pg3KLaTeX("\text{Because the speed traveled is at a constant rate, and because it is possible to have a}") → Pg3LLaTeX("\text{a line can be drawn through the coordinate points to show how the total distance traveled}") → Pg3NLaTeX("\text{was constantly changing.}") → Pg3OLaTeX("\text{This confirms the relationship shown in the table of values.}") → Pg4BVerticalText("\text{Total distance in miles \textcolor{#000099}{(d)}") → XaxisLaTeX("\text{Time in hours \textcolor{#000099}{(t)}") → YaxisVector(P1, P6) → uLaTeX("\text{Distance Traveled over Time}") → GrapheadPolygon(I, J, K, L) → RightConhide, i, j, k, lLaTeX("\text{event affects the probability of the outcome of another event.}") → WTK2LaTeX("\text{affect the probability of the outcome of another event.}") → WTK4LaTeX((("\text{Eric drove his car at \textcolor{#000099}{" * MPH) * "} miles per hour,which means that the total distance in miles}")) → Pg1BTableText({{"Time \;in\; hours \;\textcolor{#000099}{(t)}", LaTeX["\text{ \textcolor{#000099}{0} }"], LaTeX["\text{ \textcolor{#000099}{1 } }"], LaTeX["\text{ \textcolor{#000099}{2 } }"], LaTeX["\text{ \textcolor{#000099}{3} }"], LaTeX["\text{\textcolor{#000099}{ 4} }"], LaTeX["\text{ \textcolor{#000099}{5} }"]}, {"Total\; distance\; in\; miles \;\textcolor{#000099}{(d)}", LaTeX["\text{\textcolor{#000099}{\;0} }"], LaTeX[(("\text{ \textcolor{#000099}{" * MPH) * "} }")], LaTeX[(("\text{ \textcolor{#000099}{" * d2) * "} }")], LaTeX[(("\text{\textcolor{#000099}{ " * d3) * "} }")], LaTeX[(("\text{\textcolor{#000099}{" * d4) * "} }")], LaTeX[(("\text{\textcolor{#000099}{ " * d5) * "} }")]}}, "hl|_") → TableLaTeX((("\text{Average speed:\textcolor{#000099}{" * MPH) * "} miles per hour}")) → QuesLaTeX("\text{fractional number of hours (such as \textcolor{#000099}{2.5 \;hours}) instead of only a whole number of hours,}") → Pg3MLaTeX("\text{Therefore, the time is the independent quantity, and the distance is the dependent quantity.}") → Pg1DLaTeX("\text{Because “time” starts with the letter “\textcolor{#000099}{t},” let the time Eric spent driving be represented}") → Pg1FLaTeX("\text{Because “distance” starts with the letter “\textcolor{#000099}{d},” let the distance Eric traveled be represented}") → Pg1HLaTeX((("\text{Therefore, the relationship can be represented by the equation \textcolor{#000099}{d = " * MPH) * "t}.}")) → Pg1MLaTeX("\text{Use the left column of the table for the values of the independent variable, the time in}") → Pg2BLaTeX("\text{Use the right column for the values of the dependent variable, the total distance in miles (\textcolor{#000099}{d}).}") → Pg2DLaTeX((("\text{To fill in the table, choose values for \textcolor{#000099}{t} to substitute into the equation \textcolor{#000099}{d = " * MPH) * "t.}}")) → Pg2ELaTeX((((("\text{second column, let \textcolor{#000099}{t = 1}, so \textcolor{#000099}{d = " * MPH) * "(1)}, which simplifies to \textcolor{#000099}{d = ") * MPH) * "}, and so on, as shown.}")) → Pg2GLaTeX((("\text{In the first column of the table, let \textcolor{#000099}{t = 0}, so \textcolor{#000099}{d = " * MPH) * "(0)}, which simplifies to \textcolor{#000099}{d = 0}. In the}")) → Pg2FLaTeX("\text{Based on the table, as the time increases, the total distance also increases.}") → Pg2HLaTeX("\text{The independent quantity, the time in hours (\textcolor{#000099}{t}), is plotted along the \textcolor{#000099}{x}-axis of the}") → Pg3CLaTeX("\text{The dependent quantity, the total distance in miles (\textcolor{#000099}{d}), is plotted along the \textcolor{#000099}{y}-axis.}") → Pg3ELaTeX("\text{It is not possible to have a negative amount of time, so the \textcolor{#000099}{x}-axis starts at \textcolor{#000099}{0}. Likewise,}") → Pg3FLaTeX("\text{it is not possible to travel a negative total distance, so the \textcolor{#000099}{y}-axis also starts at \textcolor{#000099}{0}.}") → Pg3GLaTeX("\text{Label the \textcolor{#000099}{x}-axis “Time in hours” and label the \textcolor{#000099}{y}-axis “Total distance in miles.”}") → Pg3HLaTeX("\text{The title of the graph can be “Distance Traveled over Time.”}") → Pg3ILaTeX("\text{This graph shows that as the time increases, the total distance traveled also increases.}") → Pg4ALaTeX("\text{\mathbf{dependent\;events} events that are not independent. The outcome of one}") → Wtk1LaTeX("\text{\mathbf{independent\;events} events such that the outcome of one event does not}") → WTK3LaTeX((("\text{Average speed=" * MPH) * " miles per hour}")) → DK1