
Contour Plot Construction
Loading the math board and drawing, please wait…
In collections
intersection: surface-surface, curve-curve
intersection: surface-surface, curve-curve
intersection: surface-surface, curve-curve
intersection: surface-surface, curve-curve
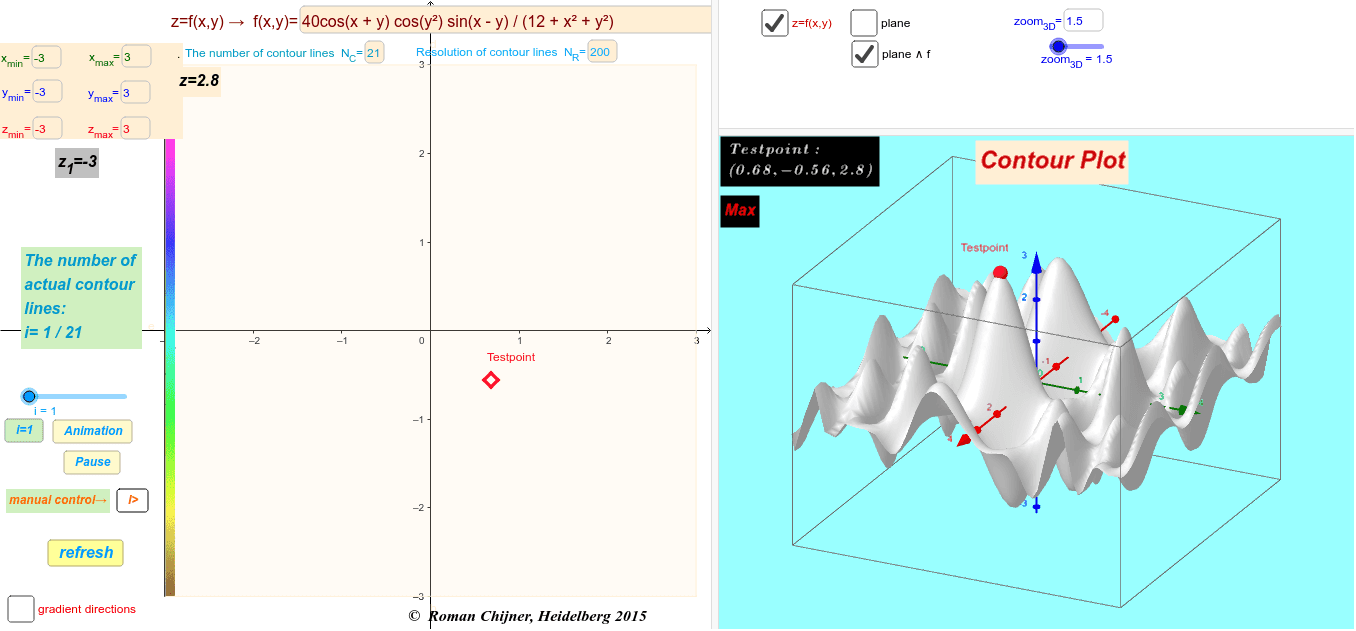
This example demonstrates how to create a contour plot in 2D space, visually representing the gradient and level curves of a function. Key math concepts include vectors, differential calculus, functions, and binomial distribution. Construction highlights GeoGebra commands like Polygon, PointIn, Segment, Function, Sum, and objects such as n, rr, and z_Step. Ideal for high school students and math enthusiasts studying function visualization and spatial geometry relations.
GeoGebra Commands & Parameters
Polygon((x_{min}, y_{min}), (x_{max}, y_{min}), (x_{max}, y_{max}), (x_{min}, y_{max})) → poly1, b, c, d, ePointIn(poly1) → PTestIf(Length[RemoveUndefined[Join[Zip[Mirror[{Roots[f0(a, x), y_{min}, y_{max}]}, y = x] + (a, 0), a, Sequence[x_{min} + ((x_{max} - x_{min}) / N_P * i), i, 0, N_P]]]]] ≟ 0, false, true) → lb1If(lb1, RemoveUndefined[Join[Zip[Reverse[{Roots[f0(x, a), x_{min}, x_{max}]}] + (0, a), a, Sequence[y_{min} + ((y_{max} - y_{min}) / N_P * i), i, 0, N_P]]]], Sequence[(10000, 10000), k, 1, 50]) → P2yyxIf(lb1, RemoveUndefined[Join[Zip[Mirror[{Roots[f0(a, x), y_{min}, y_{max}]}, y = x] + (a, 0), a, Sequence[x_{min} + ((x_{max} - x_{min}) / N_P * i), i, 0, N_P]]]], Sequence[(10000, 10000), k, 1, 50]) → P1xxySegment(B02, B01) → aTextfield(v_1) → inputBox2Textfield(f) → inputBox3Textfield(N_C) → inputBox1Textfield(x_{min}) → inputBox4Textfield(x_{max}) → inputBox5Textfield(y_{max}) → inputBox6Textfield(z_{max}) → inputBox7Textfield(y_{min}) → inputBox8Textfield(z_{min}) → inputBox9Point(a, 1 - zzii_B) → ATextfield(N_P) → inputBox10Sum(Sequence[If[f(x(PTest), y(PTest)) - f(x(Element[lr01, i]), y(Element[lr01, i])) > 0, 1, 0], i, 1, n]) → ext1Textfield(step) → inputBox12Function(f(a, b), a, x_{min} - 0.2, x_{max} + 0.2, b, y_{min} - 0.2, y_{max} + 0.2) → gTextfield(zoom_{3D}) → InputBox1Sequence((x(Element[lr01, i]), y(Element[lr01, i]), f(x(Element[lr01, i]), y(Element[lr01, i]))), i, 1, n) → lr013Sequence((x(Element[lr02, i]), y(Element[lr02, i]), f(x(Element[lr02, i]), y(Element[lr02, i]))), i, 1, n) → lr023RemoveUndefined(Sequence[If[f(x(PTest), y(PTest)) - f(x(Element[lr01, i]), y(Element[lr01, i])) > 0, i, NaN], i, 1, n]) → lr04Zip(Vector[b, a], a, Sequence[Element[lr01, Element[lr04, i]], i, 1, Length[lr04]], b, Sequence[Element[lr02, Element[lr04, i]], i, 1, Length[lr04]]) → lr06Zip(Vector[b, a], a, Sequence[Element[lr013, Element[lr04, i]], i, 1, Length[lr04]], b, Sequence[Element[lr023, Element[lr04, i]], i, 1, Length[lr04]]) → lr063Zip(Vector[a, b], a, Sequence[Element[lr01, Element[lr05, i]], i, 1, Length[lr05]], b, Sequence[Element[lr02, Element[lr05, i]], i, 1, Length[lr05]]) → lr07Zip(Vector[a, b], a, Sequence[Element[lr013, Element[lr05, i]], i, 1, Length[lr05]], b, Sequence[Element[lr023, Element[lr05, i]], i, 1, Length[lr05]]) → lr073RemoveUndefined(Sequence[If[f(x(PTest), y(PTest)) - f(x(Element[lr01, i]), y(Element[lr01, i])) > 0, i, (-i)], i, 1, n]) → lr04cAppend(lr04c, Element[lr04c, 1]) → lr04ccSum(Sequence[If[(Element[lr04cc, i] * Element[lr04cc, i + 1]) < 0, 1, 0], i, 1, n + 1]) → lr04cccIf(ext1 ≟ n, "Max", If[ext1 ≟ 0, "Min", If[(lr04ccc > 2) ∧ (lr04ccc ≤ 4), "saddle ? ", "?"]]) → TT1IntersectPath(o, g(x, y)) → s