
Exploring Correlation
Loading the math board and drawing, please wait…
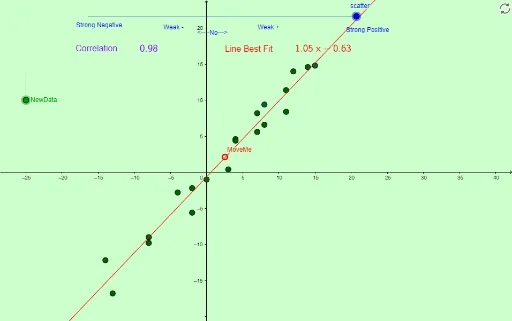
This example uses randomly generated data points to help students explore the correlation between data. Key mathematical concepts include correlation coefficient, normal distribution, and binomial distribution. Using GeoGebra commands such as If, Random, FitPoly, PMCC, etc., students can observe the distribution of data points and their correlation. Suitable for high school and above students to learn statistical knowledge.
GeoGebra Commands & Parameters
If(scatter ≟ 0, 10.5, 1 / ((5 * scatter))) → recipRandom(-5, 5) → bRandom(-15, 15) → aRandom(-15, 15) → fRandom(-15, 15) → cRandom(-15, 15) → dRandom(-15, 15) → eRandom(-15, 15) → hRandom(-15, 15) → iRandom(-15, 15) → jRandom(-15, 15) → kRandom(-15, 15) → lRandom(-15, 15) → nRandom(-15, 15) → oRandom(-15, 15) → pRandom(-15, 15) → qRandom(-15, 15) → rRandom(-15, 15) → sRandom(-15, 15) → tRandom(-15, 15) → uRandom(-15, 15) → vRandom(-15, 15) → wRandom(0, 1) → sgIf(sg ≟ 0, -1, 1) → plmnFitPoly(Z, 1) → ZZPMCC(Z) → CORRLaTeX(CORR) → text1LaTeX(ZZ) → text4