
Exploring Bayes' Theorem
Loading the math board and drawing, please wait…
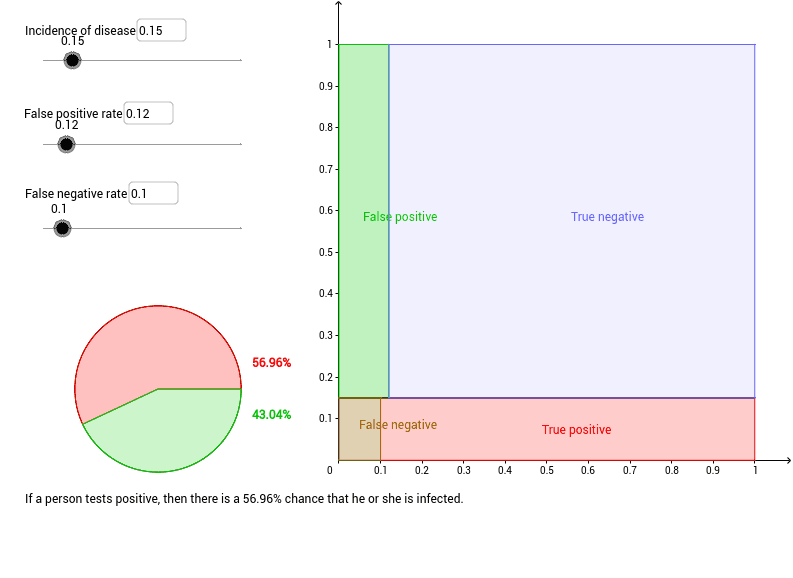
This GeoGebra worksheet demonstrates a classic application of Bayes' theorem: if a person tests positive, what is the probability that they are actually sick? The example involves core concepts of conditional probability and probability statistics. By constructing objects such as circles, polygons, and segments, users can visually understand the application of Bayes' theorem. Suitable for high school students and researchers.
GeoGebra Commands & Parameters
Intersect(xAxis, yAxis) → APoint(xAxis) → BPolygon(A, B, 4) → poly1, a, b, c, d, C, DPolygon(G, B, F, I) → poly2, g, b_1, f, iPolygon(E, J, H, D) → poly3, e, j, h, d_1Segment(E, F) → kPolygon(J, F, C, H) → poly4, j_1, f_1, c_1, h_1Polygon(A, G, I, E) → poly5, a_1, g_1, i_1, e_1Textfield(incidence) → inputBox1Textfield(falseneg) → inputBox3Textfield(falsepos) → inputBox2Circle(K, 0.2) → qCircleSector(K, L, M) → rCircleSector(K, M, L) → s