
Exploring Averages and the Effects of Outliers
Loading the math board and drawing, please wait…
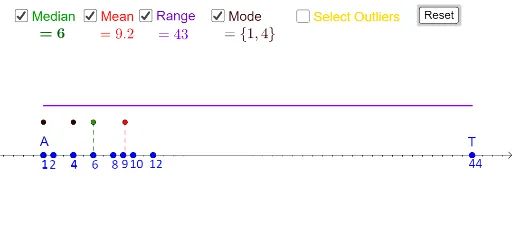
This example demonstrates how moving data points and selecting outliers affect measures of averages. It uses commands like Point, Sequence, RemoveUndefined, Segment, LineBisector, Intersect, and OrthogonalLine. Suitable for middle school and above students or teachers to understand statistical concepts such as arithmetic mean and mode.
GeoGebra Commands & Parameters
Point(xAxis) → TPoint(xAxis) → JPoint(xAxis) → IPoint(xAxis) → HPoint(xAxis) → BPoint(xAxis) → CPoint(xAxis) → DPoint(xAxis) → EPoint(xAxis) → FPoint(xAxis) → GPoint(xAxis) → ASequence((If[Element[matrix1, 2, i] ≟ 0, Element[matrix1, 1, i]], 0), i, 1, 11) → list1Sequence((If[Element[matrix1, 2, i] ≟ 1, Element[matrix1, 1, i]], 0), i, 1, 11) → list2RemoveUndefined(list1) → list3RemoveUndefined(list2) → list4Segment((Min[x(list3)], 3), (Max[x(list3)], 3)) → mSequence((Element[list5, i], 3), i, 1, Length[list4]) → list6LineBisector(m) → iIntersect(i, m) → LOrthogonalLine(Median, xAxis) → pOrthogonalLine(Mean, xAxis) → qIntersect(q, xAxis) → MIntersect(p, xAxis) → NSegment(Median, N) → sSegment(Mean, M) → t
AI Drawing Prompt Reference
Create a coordinate system and place 11 points on the x-axis in order: T, J, I, H, B, C, D, E, F, G, A. Then, generate two lists, list1 and list2, containing non-zero and non-one x-coordinates respectively. Remove any undefined values from these lists. Draw a horizontal line m with endpoints at the minimum and maximum x-coordinates of list3. Next, draw a median line p and a mean line q, both perpendicular to the x-axis. Finally, find the intersection points of these lines with the x-axis to get points N and M, and draw two line segments s and t between these points.
The prompt above was compiled from the original drawing commands and is for reference only.