
Exploring Absolute Value Equations: Effects of Parameters a, h, k on V-shaped Gr
Loading the math board and drawing, please wait…
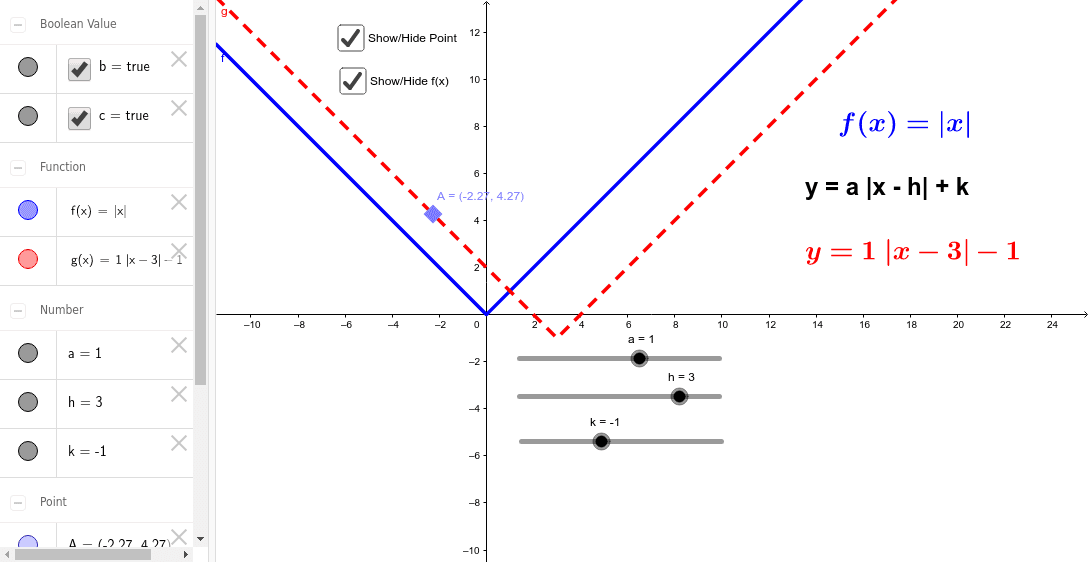
①This interactive GeoGebra file demonstrates how the graph of y=a|x-h|+k changes as parameters a, h, and k are varied, revealing the connection between absolute value equations and V-shaped parabolas. ②Core mathematical concepts include absolute value functions, vertical/horizontal translations, vertical stretching/compression, and the role of the vertex (h,k) in determining the graph's position and shape. ③Construction details: The file uses Point commands to create key points, sliders for parameters a, h, and k, and functions f and g to plot the graphs. Text objects (text1, text2, text3) display the current parameter values and the equation, enabling dynamic exploration. ④Suitable for middle school to high school students learning function transformations, as well as for classroom demonstrations or self-study, fostering visual and interactive understanding of algebraic concepts.
GeoGebra Commands & Parameters
Point(g) → A
AI Drawing Prompt Reference
Draw a V-shaped graph to illustrate how the parameters a, h, k in the equation y=a|x-h|+k affect the graph. Use sliders to control the values of a, h, k, and dynamically display the equation and key points. The graph should clearly show how the vertex (h,k) determines the graph's position and shape, and how a, h, k individually cause vertical/horizontal translations and vertical stretches/compressions.
The prompt above was compiled from the original drawing commands and is for reference only.