
Explore Function Relationships
Loading the math board and drawing, please wait…
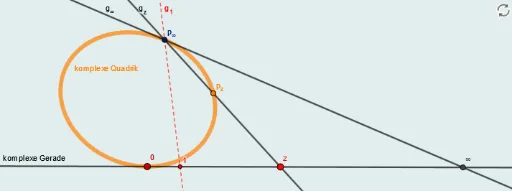
This example uses GeoGebra to demonstrate the relationships between exponential functions, rational numbers, statistics, high point intersections, and parallelograms. By drawing curves, tangents, lines, intersections, and points, students can visually understand these mathematical concepts. Suitable for high school mathematics education and learning.
GeoGebra Commands & Parameters
Conic(A, B, C, D, E) → cTangent(B, c) → f,Tangent(A, c) → g,Line(A, E) → hIntersect(f, g) → FIntersect(f, h) → GPoint(f) → HLine(A, H) → iIntersect(c, i, 2) → IPoint(f) → JLine(A, J) → j
AI Drawing Prompt Reference
Draw a conic section c, then draw two tangents f and g at points A and B on c. Draw a horizontal line h through point A, and find its intersections F and G with tangents f and g. Draw a vertical line i through point F, and find its second intersection I with c. Finally, draw a vertical line j through point G.
The prompt above was compiled from the original drawing commands and is for reference only.