
Exploration Questions on Continuity of a Function at x = a
Loading the math board and drawing, please wait…
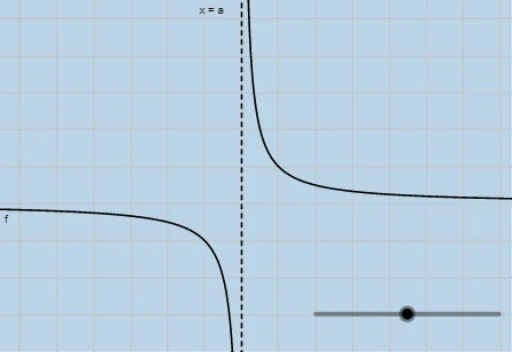
This GeoGebra example presents interactive questions about the continuity of a function f at a point x = a. It visually demonstrates the concept of continuity, allowing students to test whether a function is continuous by examining its behavior near a specific input. Core mathematical concepts include the definition of continuity (function defined at a, limit exists, and limit equals function value), one-sided limits, and types of discontinuities. The construction uses objects a, f, and g, where a is likely a slider-controlled parameter, f is the function under investigation, and g may serve as an auxiliary object to display limits or function values. By adjusting a, learners can observe changes in the graph and assess continuity. This resource is suitable for high school or introductory college calculus courses, supporting classroom demonstrations or self-paced exploration to deepen understanding of rigorous continuity conditions.
GeoGebra Commands & Parameters
Numeric a(0)f(x) = 1 / (x - a)x = a
AI Drawing Prompt Reference
Draw a function graph where there's a marked point on the x-axis representing a specific input value a, which can be adjusted using a slider. The function f is defined as 1 divided by (x minus a), and its graph changes as a changes. Also, mark a vertical line at x=a to observe the function's behavior at this point, useful for exploring the continuity of the function at x=a.
The prompt above was compiled from the original drawing commands and is for reference only.