
Exploration of Discrete Probability Distributions
Loading the math board and drawing, please wait…
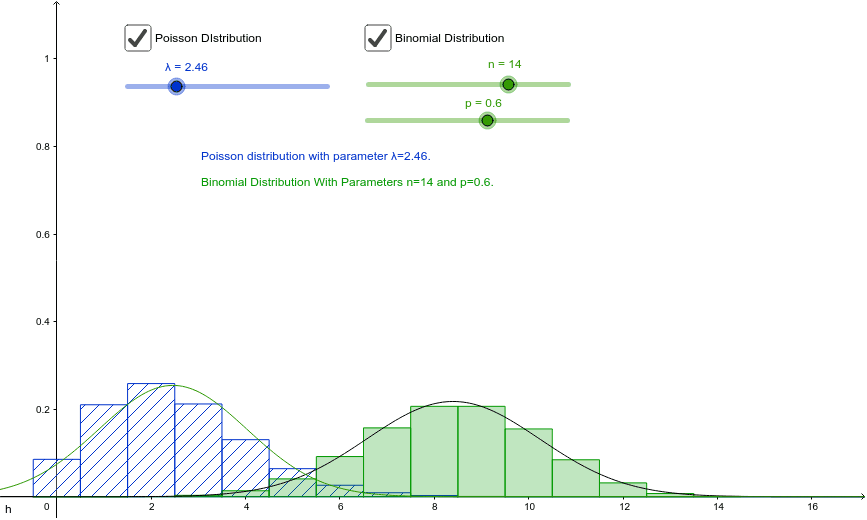
This example is used to compare the Binomial and Poisson distributions. It demonstrates the basic concepts of discrete probability distributions and allows users to observe how distributions change by adjusting parameters. Commands used include Poisson, Normal, and BinomialDist. Suitable for high school mathematics education and students learning probability and statistics.
GeoGebra Commands & Parameters
Poisson(λ) → fNormal((n * p), sqrt(((n * p) * (1 - p))), x) → hNormal(λ, sqrt(λ), x) → gBinomialDist(n, p) → i
AI Drawing Prompt Reference
Draw a discrete probability distribution graph to compare the Poisson and binomial distributions. First, plot the Poisson distribution curve, then plot the binomial distribution curve, and finally, plot the normal distribution curve to approximate the binomial distribution. Adjust the parameters to observe how the distributions change.
The prompt above was compiled from the original drawing commands and is for reference only.