
Exercise 18: Integrated Practice on Linear Equations, Pie Charts, and Unit Circl
Loading the math board and drawing, please wait…
In collections
LINEAR FUNCTIONS
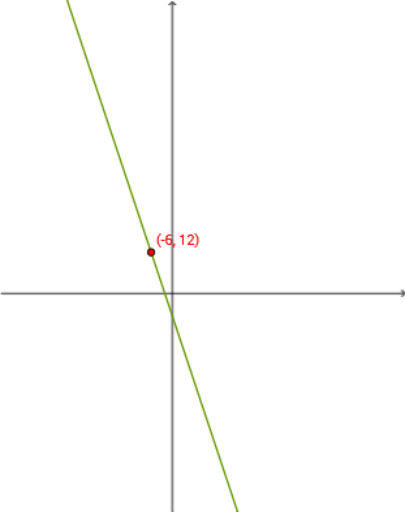
This GeoGebra example is a comprehensive interactive exercise that demonstrates the integration of linear equations, pie charts (circle charts), median lines, the unit circle, and logic reasoning within a single dynamic worksheet. The core mathematical concepts covered include graphing and properties of linear equations, proportional representation in pie charts, statistical median lines, trigonometric relationships on the unit circle, and conditional logic checks. In terms of construction, the summary reveals the use of commands such as Random and RandomElement to generate random data, Textfield and InputBox for user input, and TableText for tabular display. Numerous objects are created, including a button (button1), sliders (m), points (A1, B1, etc.), lines (d, b, c, etc.), and text labels, all driven by button clicks and input boxes to update dynamically. This exercise is suitable for middle and high school students to reinforce integrated knowledge of algebra, statistics, and trigonometry. It can serve as an interactive classroom activity or a self-assessment tool, with randomly generated problems and immediate feedback to enhance engagement.
GeoGebra Commands & Parameters
Random(-10, 10) → d_1Random(-10, 10) → b_1Random(-10, 10) → bRandomElement({-5, -4, -3, -2, -1, 1, 2, 3, 4, 5}) → c_1Random(-10, 10) → aRandomElement({-5, -4, -3, -2, -1, 1, 2, 3, 4, 5}) → a_1RandomElement({-5, -4, -3, -2, -1, 1, 2, 3, 4, 5}) → cTextfield(h) → InputBox1Textfield(m) → InputBox2Textfield(f) → InputBox4Random(-10, 10) → d_2TableText({{A1_1, B_1, C_1, D_1}, {-3, g(-3), h(-3), f(-3)}, {-2, g(-2), h(-2), f(-2)}, {-1, g(-1), h(-1), f(-1)}, {0, g(0), h(0), f(0)}, {1, g(1), h(1), f(1)}, {2, g(2), h(2), f(2)}, {3, g(3), h(3), f(3)}, {1, e, l, k}}, "|_r") → text3_1