
Exercise 16
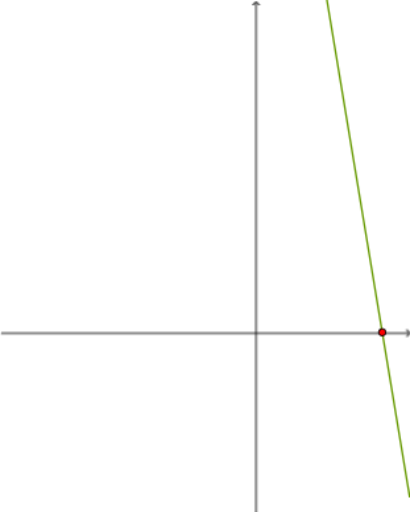
Loading the math board and drawing, please wait…
In collections
LINEAR FUNCTIONS
This example demonstrates the creation of a frequency distribution chart, involving concepts such as frequency distribution, mode, and pie chart. Using GeoGebra commands like Random, RandomElement, and Textfield, a dynamic frequency distribution chart can be constructed. Suitable for statistics education.
GeoGebra Commands & Parameters
Random(-10, 10) → d_1Random(-10, 10) → b_1Random(-10, 10) → bRandomElement({-5, -4, -3, -2, -1, 1, 2, 3, 4, 5}) → c_1Random(-10, 10) → aRandomElement({-5, -4, -3, -2, -1, 1, 2, 3, 4, 5}) → a_1RandomElement({-5, -4, -3, -2, -1, 1, 2, 3, 4, 5}) → cTextfield(h) → InputBox1Textfield(m) → InputBox2Textfield(f) → InputBox4Random(-10, 10) → d_2Intersect(g, xAxis) → CTableText({{A1_1, B_1, C_1, D_1}, {-3, g(-3), h(-3), f(-3)}, {-2, g(-2), h(-2), f(-2)}, {-1, g(-1), h(-1), f(-1)}, {0, g(0), h(0), f(0)}, {1, g(1), h(1), f(1)}, {2, g(2), h(2), f(2)}, {3, g(3), h(3), f(3)}, {1, e, l, k}}, "|_r") → text3_1