
Exercise 10: Function Graph and Translation
Loading the math board and drawing, please wait…
In collections
LINEAR FUNCTIONS
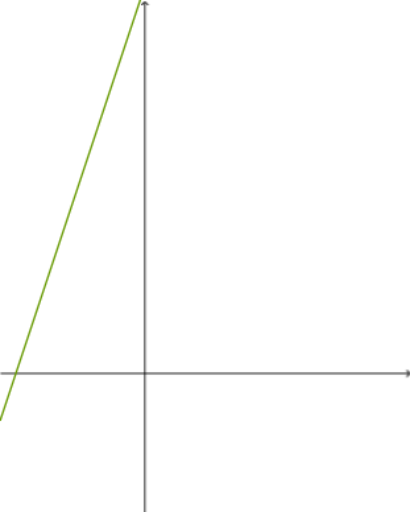
This example demonstrates the translation of function graphs. Key mathematical concepts include function graphs and translation. Using GeoGebra commands such as Random, RandomElement, and Textfield, dynamic generation of different function graphs and observation of their translation effects are achieved. Suitable for high school mathematics education and learning.
GeoGebra Commands & Parameters
Random(-10, 10) → aRandomElement({-5, -4, -3, -2, -1, 1, 2, 3, 4, 5}) → a_1RandomElement({-5, -4, -3, -2, -1, 1, 2, 3, 4, 5}) → cRandom(-10, 10) → bTextfield(h) → InputBox1Random(-10, 10) → b_1RandomElement({-5, -4, -3, -2, -1, 1, 2, 3, 4, 5}) → c_1Random(-10, 10) → d_1Textfield(m) → InputBox2Textfield(f) → InputBox4Random(-10, 10) → d_2TableText({{A1_1, B_1, C_1, D_1}, {-3, g(-3), h(-3), f(-3)}, {-2, g(-2), h(-2), f(-2)}, {-1, g(-1), h(-1), f(-1)}, {0, g(0), h(0), f(0)}, {1, g(1), h(1), f(1)}, {2, g(2), h(2), f(2)}, {3, g(3), h(3), f(3)}, {1, e, l, k}}, "|_r") → text3_1
AI Drawing Prompt Reference
Draw a function graph and observe its transformation through translation. First, randomly generate a function in the form of y = a*x + b. Then, apply a translation to create another function y = a_1*(x - c) + b_1. Input the function expression in the text field to see the changes in the graph.
The prompt above was compiled from the original drawing commands and is for reference only.