
Exercise 1: Linear Functions and Vectors
Loading the math board and drawing, please wait…
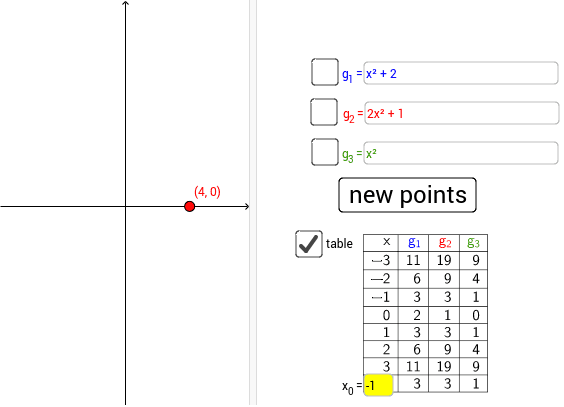
This example demonstrates how to use GeoGebra to draw linear functions and related vectors. Key mathematical concepts include linear functions, vectors, and function graphs. By using commands like Random, RandomElement, and Textfield, users can dynamically explore the relationship between functions and vectors. Suitable for high school mathematics education and learning.
GeoGebra Commands & Parameters
Random(-10, 10) → aRandom(-10, 10) → bRandomElement({-5, -4, -3, -2, -1, 1, 2, 3, 4, 5}) → cTextfield(h) → InputBox1RandomElement({-5, -4, -3, -2, -1, 1, 2, 3, 4, 5}) → a_1Random(-10, 10) → b_1RandomElement({-5, -4, -3, -2, -1, 1, 2, 3, 4, 5}) → c_1Random(-10, 10) → d_1Textfield(m) → InputBox2Textfield(g) → InputBox3Textfield(f) → InputBox4TableText({{A1_1, B_1, C_1, D_1}, {-3, g(-3), h(-3), f(-3)}, {-2, g(-2), h(-2), f(-2)}, {-1, g(-1), h(-1), f(-1)}, {0, g(0), h(0), f(0)}, {1, g(1), h(1), f(1)}, {2, g(2), h(2), f(2)}, {3, g(3), h(3), f(3)}, {1, e, l, k}}, "|_r") → text3_1
AI Drawing Prompt Reference
Draw a graph showing linear functions and vectors, highlighting their relationship. Generate random parameters for linear functions, plot several function graphs, and label related vectors. Create a dynamic table showing values of the functions at different points, including three linear functions and a vector, separated by vertical lines. Add input boxes to allow dynamic modification of function parameters for interactivity.
The prompt above was compiled from the original drawing commands and is for reference only.