
Examine the Continuity of f(x)
Loading the math board and drawing, please wait…
In collections
Calculus C01_Limits&Their Properties
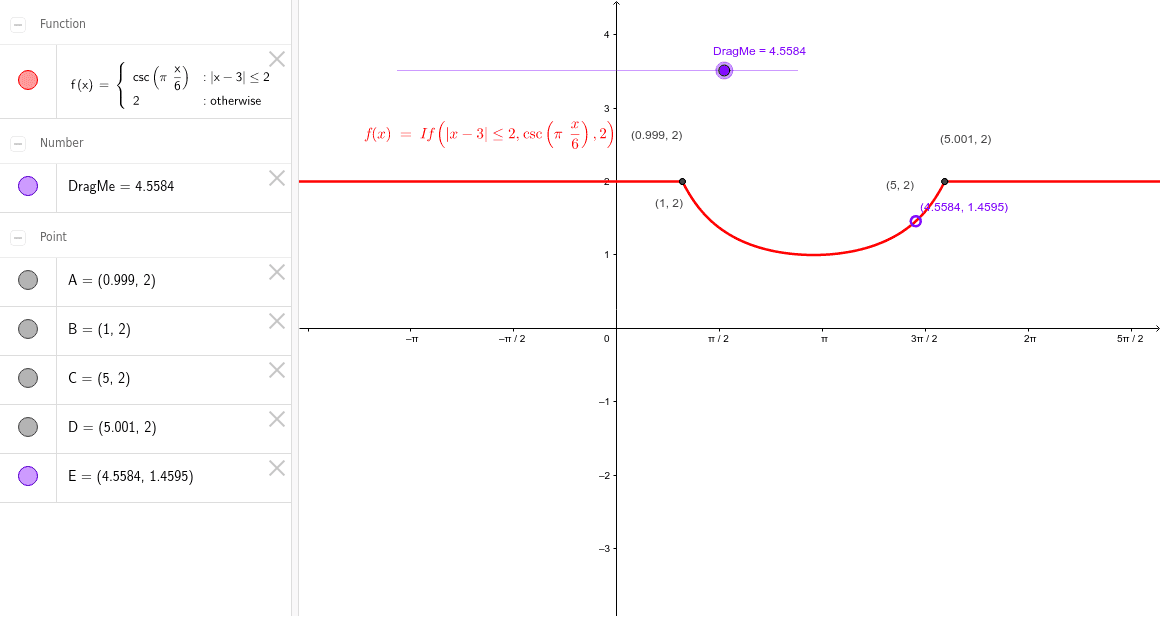
This example uses dynamic graphics to illustrate the continuity of the function f(x). Key mathematical concepts include continuity, limits, and derivatives. Using GeoGebra commands If and objects f, A, D, B, C, DragMe, E, the example allows users to observe changes in continuity at different points. Suitable for high school mathematics education, particularly in calculus courses.
GeoGebra Commands & Parameters
If(abs(x - 3) ≤ 2, csc(π * x / 6), 2) → f
AI Drawing Prompt Reference
Draw a function f(x) that smoothly transitions from csc(πx/6) to a constant 2 as x approaches 3, and observe the continuity changes around x=3. Start by drawing the x-axis and y-axis, then plot the graph of csc(πx/6), followed by a horizontal line at y=2. Use a conditional statement to display f(x) near x=3 to illustrate its continuity.
The prompt above was compiled from the original drawing commands and is for reference only.