
Estimating Means from Grouped Frequency Tables
Loading the math board and drawing, please wait…
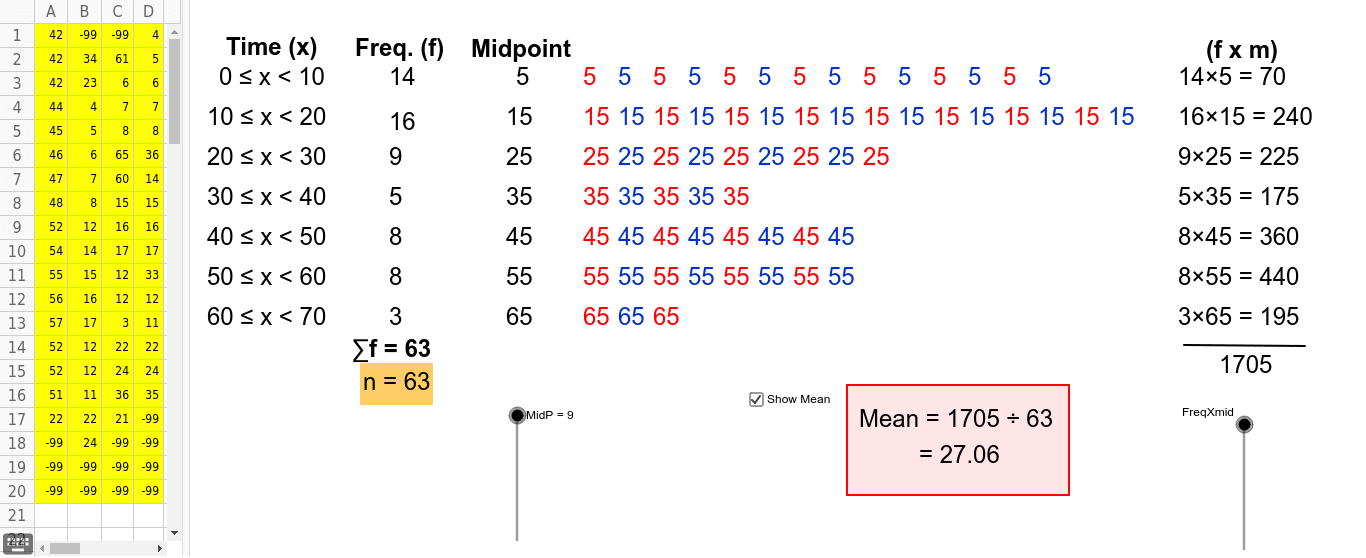
This example demonstrates how to calculate estimated means from grouped frequency tables. Users can modify data in spreadsheet view or delete it using -99 to understand the estimation process. Key math concepts include frequency distribution and mean estimation. GeoGebra commands like Segment, Min, and Polygon are used to construct and manipulate geometric objects such as B, A, a, B19-B20, A20-A5. Suitable for middle school and above students learning probability & statistics.
GeoGebra Commands & Parameters
Segment(A, B) → aMin(CountIf[x < 20, A1:D20] - CountIf[x < 10, A1:D20], 16) → bMin(CountIf[x < 30, A1:D20] - CountIf[x < 20, A1:D20], 16) → cMin(CountIf[x < 40, A1:D20] - CountIf[x < 30, A1:D20], 16) → dMin(CountIf[x < 70, A1:D20] - CountIf[x < 60, A1:D20], 16) → gMin(CountIf[x < 60, A1:D20] - CountIf[x < 50, A1:D20], 16) → fMin(CountIf[x < 50, A1:D20] - CountIf[x < 40, A1:D20], 16) → ePolygon(C, D, E, F) → poly1, c_1, d_1, e_1, f_1Polygon(G, H, I, J) → poly2, g_1, h_1, i, jPolygon(K, L, M, N) → poly3, k, l, m, nPolygon(K_1, L_1, M_1, N_1) → poly3_1, k_1, l_1, m_1, n_1Polygon(K_2, L_2, M_2, N_2) → poly3_2, k_2, l_2, m_2, n_2Polygon(K_3, L_3, M_3, N_3) → poly3_3, k_3, l_3, m_3, n_3Polygon(K_4, L_4, M_4, N_4) → poly3_4, k_4, l_4, m_4, n_4Polygon(K_5, L_5, M_5, N_5) → poly3_5, k_5, l_5, m_5, n_5
AI Drawing Prompt Reference
Draw a geometric illustration showing how to estimate means from grouped frequency tables. Start with a base line, then create different colored polygons above it to represent frequency in various intervals, with vertex positions calculated based on data, shapes and sizes reflecting data distribution, forming a statistical pattern of multiple polygons to help understand frequency distribution and mean estimation.
The prompt above was compiled from the original drawing commands and is for reference only.