
Estimate Pi Using Monte Carlo Method
Loading the math board and drawing, please wait…
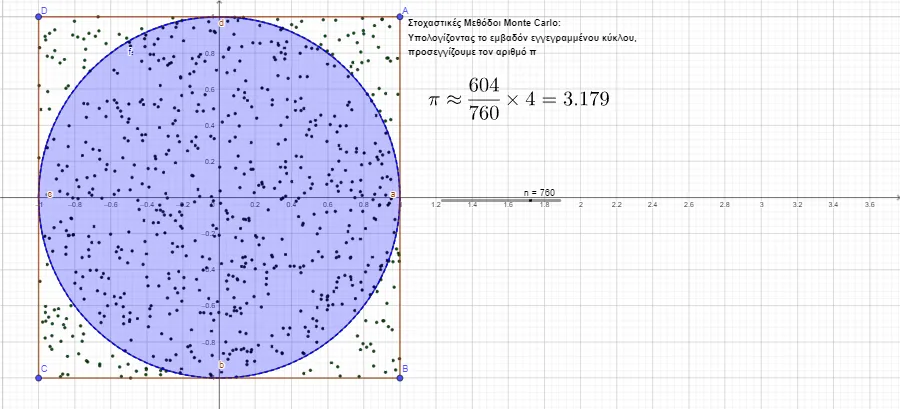
This example demonstrates the Monte Carlo method to estimate the value of pi (π). It uses GeoGebra commands like Sequence, Sum, and Polygon to create a set of random points and calculates the ratio of points inside the unit circle to estimate π. Suitable for high school math education and students learning probability and statistics.
GeoGebra Commands & Parameters
Sequence(((2 * random()) - 1, (2 * random()) - 1), k, 1, n, 1) → dartsSequence(If[(x(Element[darts, k]))^(2) + (y(Element[darts, k]))^(2) < 1, Element[darts, k]], k, 1, n) → list1Sum(Zip[f(A), A, darts]) → inPolygon(A, B, C, D) → q1, a, b, c, d
AI Drawing Prompt Reference
Draw a square with vertices at the four corners of a coordinate plane, each side length 2, centered at the origin. Scatter a large number of random points uniformly across the entire square. Then, draw a unit circle centered at the origin, inscribed within the square. Count the points that fall inside the circle and display the ratio of inside points to total points. Highlight the points inside the circle in one color and those outside in another, to visually demonstrate the Monte Carlo estimation of pi.
The prompt above was compiled from the original drawing commands and is for reference only.