
Equivalent Fractions Visualized: Pie Chart Comparison with Interactive Sliders
Loading the math board and drawing, please wait…
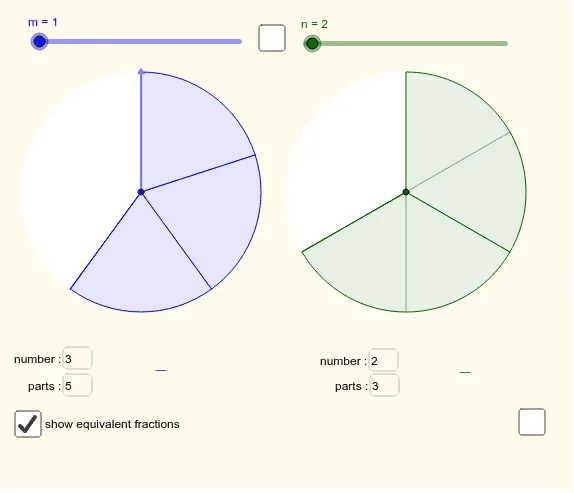
① This example demonstrates two fractions as parts of a pie chart, allowing users to visually compare their sizes and determine whether they are equivalent (equal in value). ② The core mathematical concept is equivalent fractions, involving numerators, denominators, simplification, common denominators, and proportional reasoning. ③ Construction highlights: Using GeoGebra commands such as Point, Circle, Rotate, Sequence, CircleSector, and Textfield, the sketch creates a circle divided into sectors. Users input two fractions via text boxes, and sliders adjust parameters; a button triggers updates. The two fractions are displayed as colored sectors in the pie, with corresponding text labels. ④ Suitable for upper elementary to middle school students learning fraction concepts, proportions, and equivalence, as well as for classroom demonstrations or self-directed exploration to deepen understanding of fraction equivalence through interactive manipulation.
GeoGebra Commands & Parameters
Point(y = y(A)) → BPoint(x = x(A)) → A'Circle(A, A') → cCircle(B, B') → dRotate(A', (((-(m1 / m2)) * 360))°, A) → A''Rotate(B', (((-(n1 / n2)) * 360))°, B) → B''Sequence(Segment[A, Rotate[A', ((i * 360) * ° / ka), A]], i, 1, ka) → list1CircleSector(A, A'', A') → eCircleSector(B, B'', B') → fTextfield(m1) → inputBox1Textfield(m2) → inputBox2Textfield(n1) → inputBox3Textfield(n2) → inputBox4Sequence(Segment[B, Rotate[B', (((-i) * 360) * ° / kb), B]], i, 1, (n * n1)) → list4Sequence(Segment[B, Rotate[B', ((i * 360) * ° / kb), B]], i, 1, kb) → list2Sequence(Segment[A, Rotate[A', (((-i) * 360) * ° / ka), A]], i, 1, (m * m1)) → list3Sequence(Segment[A, Rotate[A', (((-i) * 360) * ° / m2), A]], i, 1, m1) → list5Sequence(Segment[B, Rotate[B', (((-i) * 360) * ° / n2), B]], i, 1, n1) → list6
AI Drawing Prompt Reference
Create a pie chart to visualize two fractions, with sliders controlling the numerators and denominators. Compare the sizes of the fractions using two colored sectors, displaying corresponding fraction labels. The sectors are created by rotating and segmenting a circle, involving points, lines, and sectors in the construction process. Use text boxes for inputting fraction parameters.
The prompt above was compiled from the original drawing commands and is for reference only.