
Equivalent Fractions - Visual Models by John Ulbright
Loading the math board and drawing, please wait…
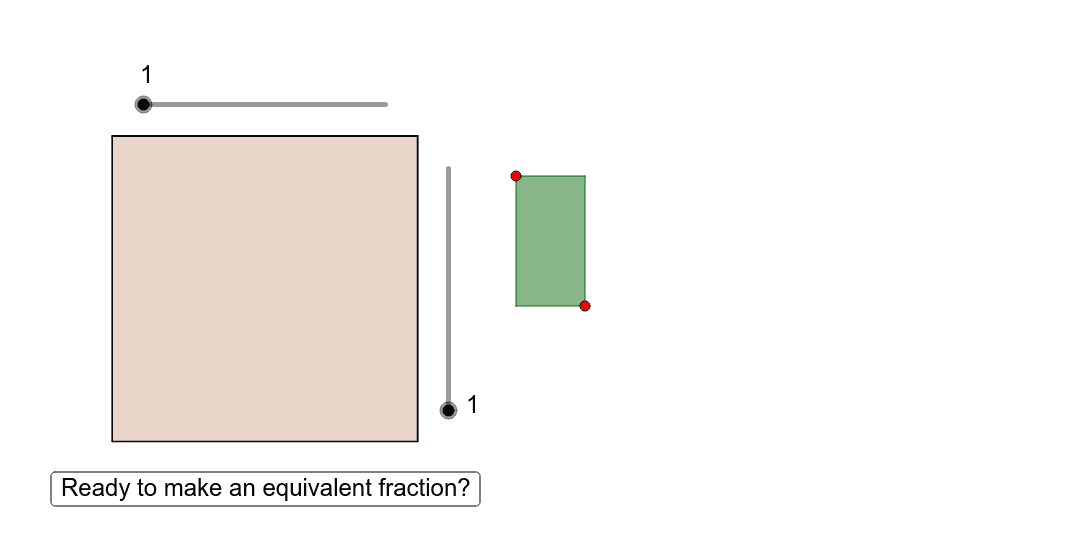
This example demonstrates the concept of equivalent fractions using visual models. Core math concepts include fractions, geometric representations, and proportional relationships. It is constructed using GeoGebra commands like Polygon, Function, Point, Intersect, and Sequence. Suitable for upper elementary and middle school students to understand the fundamental properties of fractions and the visual representation of equivalent fractions.
GeoGebra Commands & Parameters
Polygon(E, G, F, H) → poly2, e_1, g, f_1, hFunction(w, 1.8 + poly2, 2.8) → wrPoint(wr) → QIntersect(xAxis, yAxis) → APoint(xAxis) → BPoint(yAxis) → DPolygon(A, B, C, D) → poly1, a, b, c, dSequence(Segment[(0, i / Horizontal), (1, i / Horizontal)], i, 1, Horizontal) → list1Sequence(Segment[(i / Vertical, 0), (i / Vertical, 1)], i, 1, Vertical) → list2Sequence(Segment[(1.8, i / HorizontaI), (2.8, i / HorizontaI)], i, 1, HorizontaI) → list1_1Polygon(J, R, Q, S) → poly4, i, j, k, lSequence(Segment[(1.8 + i / VerticaI, 0), (1.8 + i / VerticaI, 1)], i, 1, VerticaI) → list2_1Polygon((1.8, 1), (2.8, 1), (2.8, 0), (1.8, 0)) → poly3, m, p, q, r
AI Drawing Prompt Reference
Create a geometric diagram to demonstrate the concept of equivalent fractions, featuring a rectangle divided into multiple smaller rectangles and connected lines to show the geometric representation and proportional relationships of fractions. Start by drawing a rectangle, then add smaller rectangles inside it, connect key points with lines, and finally link the edges of the rectangle to the inner rectangles with curves to form a visual model of equivalent fractions.
The prompt above was compiled from the original drawing commands and is for reference only.