
Equivalent Fractions by Robert Fant
Loading the math board and drawing, please wait…
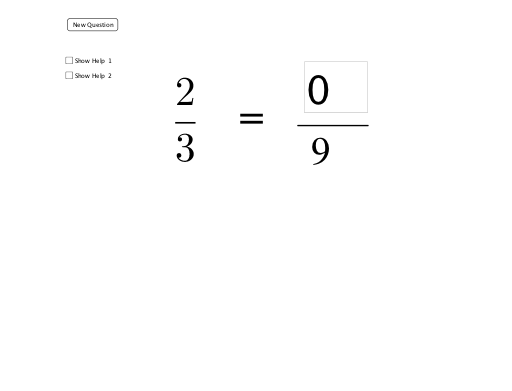
This example dynamically demonstrates equivalent fractions through various geometric models, visually illustrating the concept of fraction equivalence. Core math concepts include fraction representation, geometric modeling, and equivalence relationships. Construction highlights involve Random commands, Textfield, Segment, Point, Circle, Sequence, Sector, and Vector objects to create fraction visuals. Suitable for middle school mathematics teaching to help students understand and compare different forms of equivalent fractions.
GeoGebra Commands & Parameters
Random(2, 10) → D1Random(2, 10) → D2Random(1, D1 - 1) → N1Random(1, D2 - 1) → N2Textfield(a_1) → inputBox1Segment(A, B) → dPoint(xAxis) → CPoint(xAxis) → DCircle(C, D) → ePoint(xAxis) → EPoint(xAxis) → FCircle(E, F) → fSequence(Rotate[D, (360° * i / D1), C], i, 1, D1) → list1Sequence(Segment[C, Element[list1, i]], i, 1, D1 + 1) → list2Sector(e, D, Element[list1, N1]) → gSequence(Rotate[F, (360° * i / b), E], i, 1, b) → list3Sequence(Segment[E, Element[list3, i]], i, 1, b) → list4Sector(f, F, Element[list3, Numerator]) → hCircle(E, 1.3) → kVector(I, J) → vVector(G, H) → u
AI Drawing Prompt Reference
Draw two circles with centers on the x-axis, one with radius D and the other with radius F. Divide the first circle into D1 equal parts and draw D1 sectors, then fill N1 of them. Divide the second circle into D2 equal parts and draw D2 sectors, then fill N2 of them. Connect the centers of the two circles to the x-axis points with line segments. Draw a vector from the center of the first circle to the center of the second circle.
The prompt above was compiled from the original drawing commands and is for reference only.