
Epsilon-Delta Definition of a Limit
Loading the math board and drawing, please wait…
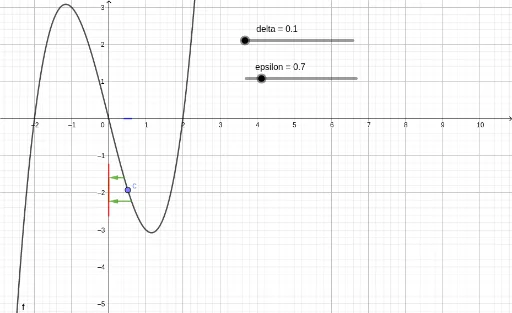
This example illustrates the ε-δ definition of a limit. It involves the core concept of limits, dynamically adjusting ε and δ values to observe changes in the function f(x) near point c. GeoGebra commands used include Point, OrthogonalLine, Intersect, Circle, Segment, Vector, Min, Max, and Limit. Suitable for high school mathematics education, particularly in calculus courses.
GeoGebra Commands & Parameters
Point(f) → cOrthogonalLine(c, xAxis) → gIntersect(g, xAxis) → cxCircle(cx, delta) → dIntersect(d, xAxis) → B, CSegment(B, C) → hVector(c, cx) → uOrthogonalLine(c, yAxis) → iIntersect(i, yAxis) → AOrthogonalLine(B, xAxis) → jMin(f, x(B), x(C)) → minBCMax(f, x(B), x(C)) → maxBCOrthogonalLine(minBC, yAxis) → kIntersect(k, yAxis) → DOrthogonalLine(maxBC, yAxis) → lIntersect(l, yAxis) → ESegment(E, D) → mVector(maxBC, E) → vVector(minBC, D) → wLimit(f, x(c)) → LPoint({0, L}) → PLCircle(PL, epsilon) → eIntersect(e, yAxis) → F, GSegment(G, F) → n
AI Drawing Prompt Reference
Draw a function f(x) near point c, dynamically adjust ε and δ values to observe changes. First, take point c on f(x), draw a perpendicular line g from c to the x-axis, intersecting at cx. Draw a circle d with cx as the center and δ as the radius, intersecting the x-axis at B and C. Draw a line segment h between B and C. Draw a vector u from c to the x-axis, draw a perpendicular line i from c to the y-axis, intersecting at A. Draw a perpendicular line j from B to the x-axis, intersecting at D. Find the minimum value minBC and maximum value maxBC of f(x) between B and C, draw a perpendicular line k from minBC to the y-axis, intersecting at D. Draw a perpendicular line l from maxBC to the y-axis, intersecting at E. Draw a line segment m between E and D. Draw a vector v from maxBC to E, draw a vector w from minBC to D. Calculate the limit L of f(x) at point c, draw a point PL on the y-axis corresponding to L, draw a circle e with PL as the center and ε as the radius, intersecting the y-axis at F and G. Draw a line segment n between F and G.
The prompt above was compiled from the original drawing commands and is for reference only.