
Energy Diagrams 2
Loading the math board and drawing, please wait…
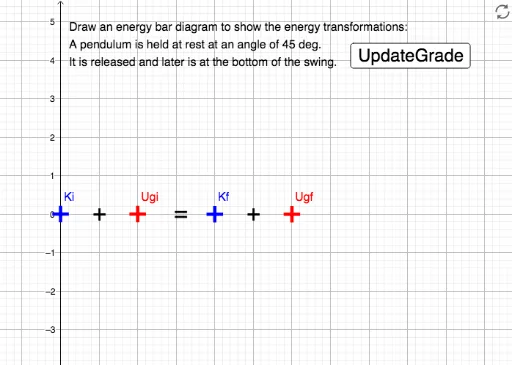
This example demonstrates the construction of energy diagrams. Key mathematical concepts include energy changes, linear equations, and random variables. Using GeoGebra commands such as Intersect, Point, and Line, the energy diagram is constructed. Suitable for high school physics and mathematics education.
GeoGebra Commands & Parameters
Intersect(xAxis, yAxis) → APoint(Circle[A, 1]) → BLine(D, E) → gPoint(yAxis) → CLine(C, yAxis) → fLine(F, f) → hLine(G, f) → iLine(H, f) → jIntersect(f, xAxis) → IIntersect(h, xAxis) → JIntersect(i, xAxis) → KIntersect(j, xAxis) → LPoint(f) → KiPoint(h) → UgiPoint(i) → KfPoint(j) → UgfSegment(Ki, I) → kSegment(Ugi, J) → lSegment(Kf, K) → Kf_1Segment(Ugf, L) → Ugf_1If(-0.1 < y(Ki) < 0.1, true, false) → KiCheckIf(y(Kf) > 0, true, false) → KfCheckIf(-0.1 < deltaE < 0.1, true, false) → deltaECheckIf(KiCheck ∧ KfCheck ∧ deltaECheck, 1, 0) → grade
AI Drawing Prompt Reference
Draw an energy diagram with two vertical lines f and g, and two horizontal lines h and i. Line f intersects the x-axis at point I, line g intersects the x-axis at point J, line h intersects the x-axis at point K, and line i intersects the x-axis at point L. Ensure that points I, K, J, and L are close to the x-axis, and the energy change between lines f and h is less than 0.1.
The prompt above was compiled from the original drawing commands and is for reference only.