
End Behavior of Rational Functions Practice
Loading the math board and drawing, please wait…
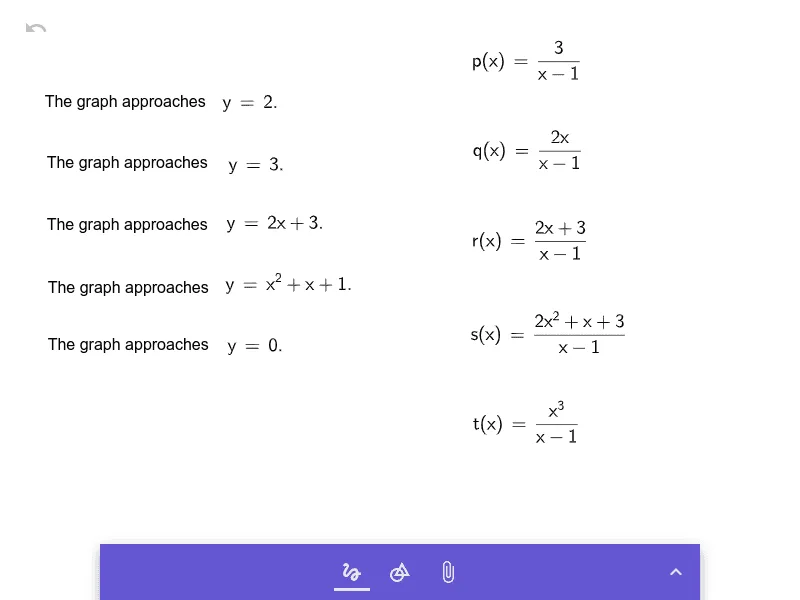
This example demonstrates how to graph and analyze the end behavior of rational functions using GeoGebra, focusing on asymptotes and symmetry. Key math concepts include rational functions, end behavior, asymptotes, and symmetry. GeoGebra commands and objects like a, b, c, d, e, f, g, h, i, j, k, l, m, n, o, p are used for function definition, graphing, and dynamic adjustments. Suitable for high school students learning the properties and graphs of rational functions.
GeoGebra Commands & Parameters
Inlinetext aInlinetext bInlinetext cInlinetext dInlinetext eFormula fFormula gFormula hFormula iFormula jFormula kFormula lFormula mFormula nFormula oFormula p
AI Drawing Prompt Reference
Draw a rational function graph with asymptotes and symmetry, define the function f(x) = (ax + b) / (cx + d), analyze its end behavior, observe the horizontal and vertical asymptotes, and check the function's symmetry.
The prompt above was compiled from the original drawing commands and is for reference only.