
Effect of Parameter a on Parabola y=x²
Loading the math board and drawing, please wait…
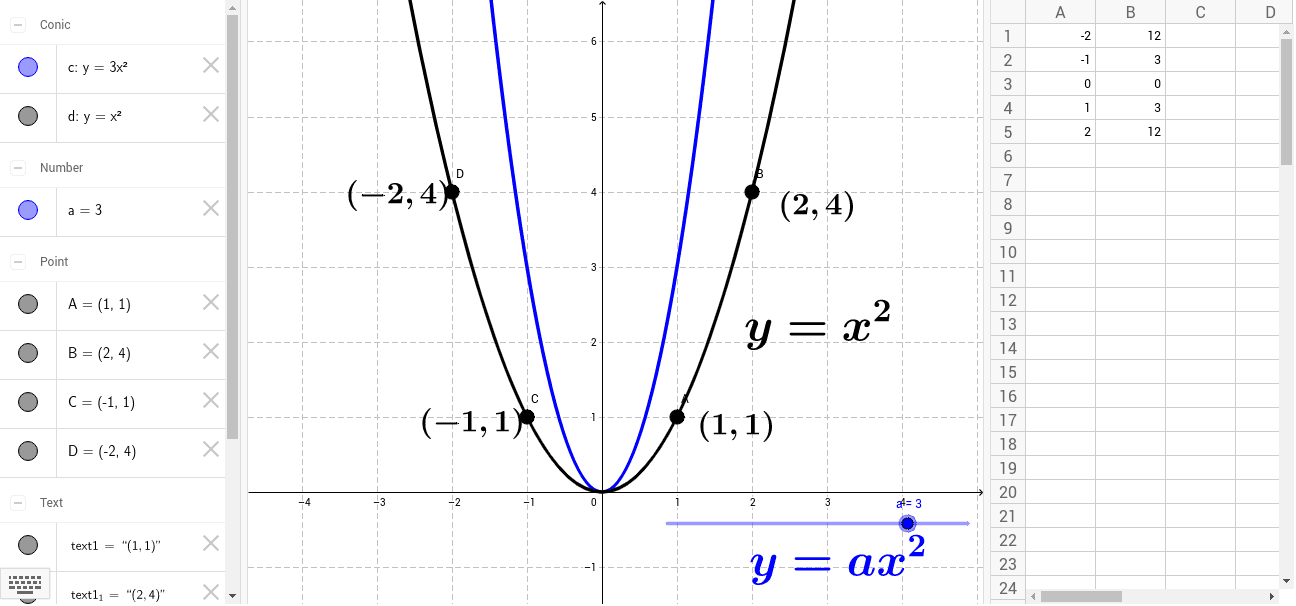
This example demonstrates how the coefficient a transforms the basic parabola y = x², showing vertical stretching, compression, and reflection. Core concepts include quadratic function graphs, parameter transformations, vertex movement, and changes in opening direction and width. Construction uses the Point command to create parameter points a, c and series of points A1‑A5, B1‑B5, together with a slider controlling a to dynamically generate the corresponding parabola and coordinate labels. Suitable for high‑school mathematics lessons on functions and graphs, self‑guided exploration, or exam review.
GeoGebra Commands & Parameters
Point(d) → APoint(d) → BPoint(d) → CPoint(d) → D
AI Drawing Prompt Reference
Create a visual demonstration showing how the coefficient a transforms the basic parabola y = x². The illustration should include a control element for parameter a that dynamically generates corresponding parabolas as a varies, illustrating vertical stretching, compression, and reflection across the x-axis. Key concepts to convey include quadratic function graphs, changes in opening direction and width, and parameter transformation effects. This visualization is suitable for high school mathematics lessons on functions and graphs, self-guided exploration, or exam review.
The prompt above was compiled from the original drawing commands and is for reference only.