
Effect of Linear Transformations on 1-Variable Statistics
Loading the math board and drawing, please wait…
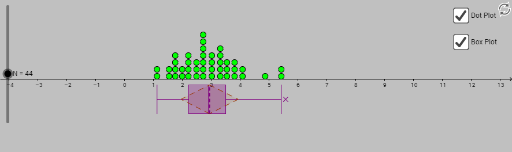
This example demonstrates how linear transformations affect one-variable statistics, including mean, standard deviation, and box plots. Key math concepts involved are linear transformations, mean, standard deviation, statistics, and box plots. Construction highlights the use of GeoGebra commands and objects like Sequence, Zip, Polygon, Textfield, DotPlot, BoxPlot, and Segment to visualize data changes. Suitable for high school and above, for understanding the impact of data transformations on statistical measures.
GeoGebra Commands & Parameters
Sequence(RandomNormal[3, 0.8], k, 1, N) → list1Zip((a, (0.8 * random())), a, list1) → originalPolygon((MeanX[original], 1 - 2.2), (MeanX[original] - SDX[original], 1.5 - 2.2), (MeanX[original], 2 - 2.2), (MeanX[original] + SDX[original], 1.5 - 2.2)) → diamondOriginal, f, g, h, iZip(((a * x(q)) + b, y(q)), q, original) → newTextfield(a) → InputBox1Textfield(b) → InputBox2DotPlot(x(original), true, 1.2) → originalDotsDotPlot(x(new), true, 1.2) → newDotsBoxPlot(-0.7, 0.5, x(original), true) → boxOriginalSegment((MeanX[original], 1 - 2.2), (MeanX[original], 2 - 2.2)) → meanOriginalBoxPlot(-0.7, 0.5, x(new), true) → boxNewPolygon((MeanX[new], 1 - 2.2), (MeanX[new] - SDX[new], 1.5 - 2.2), (MeanX[new], 2 - 2.2), (MeanX[new] + SDX[new], 1.5 - 2.2)) → diamondNew, j, k, l, mSegment((MeanX[new], 1 - 2.2), (MeanX[new], 2 - 2.2)) → meanNew
AI Drawing Prompt Reference
Illustrate the effect of linear transformations on one-variable statistics, including mean, standard deviation, and box plots. Generate a set of normally distributed data, apply linear transformations, and plot the original and transformed data points, box plots, and mean lines, highlighting the standard deviation ranges to visually compare statistical changes before and after transformation.
The prompt above was compiled from the original drawing commands and is for reference only.