
Eccentric Axial Loading: Stress Distribution on a Section
Loading the math board and drawing, please wait…
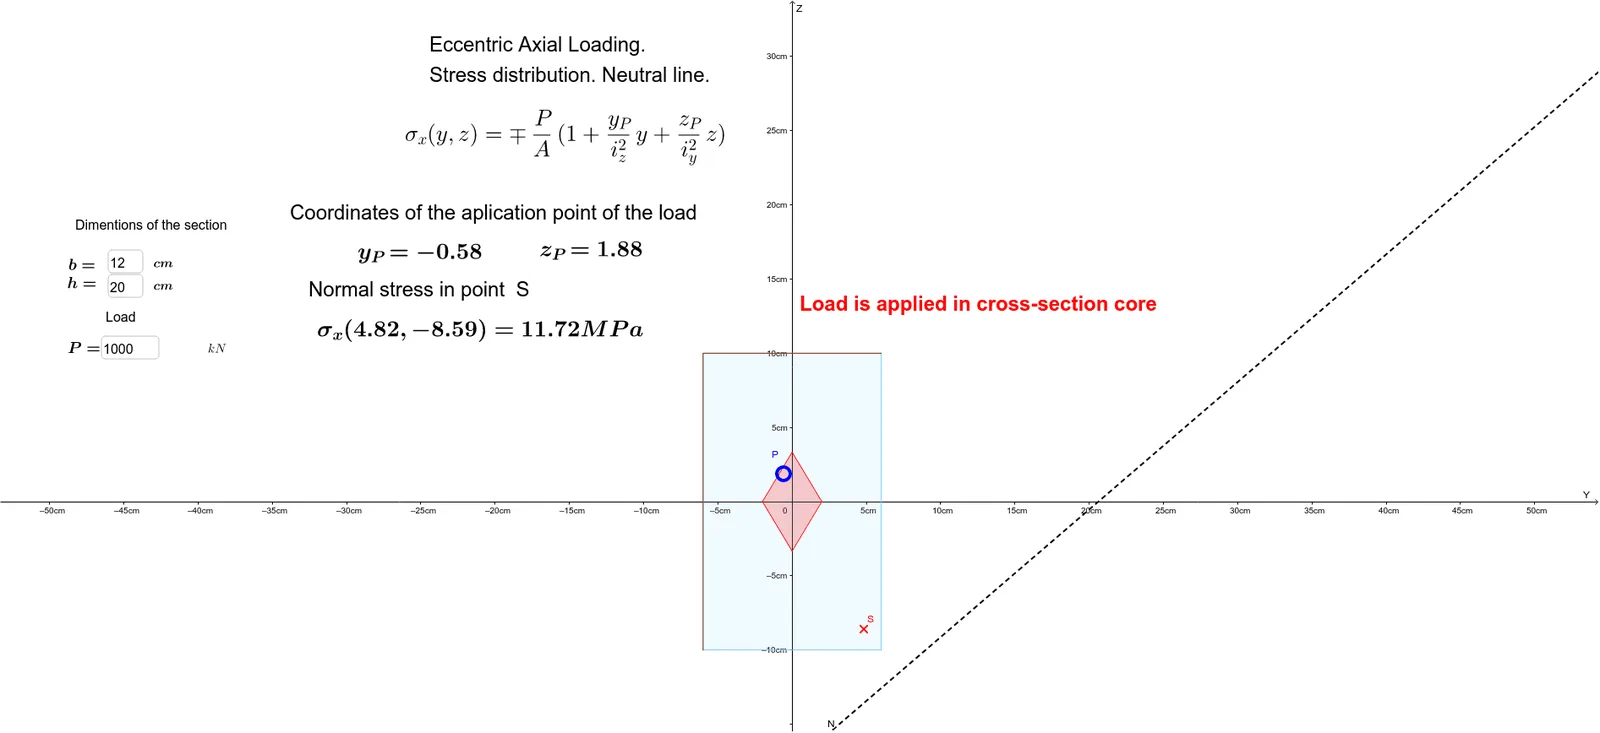
①This example demonstrates how the stress distribution on a rectangular cross-section changes when an axial load is applied eccentrically, visually showing the compression and tension zones. ②Core mathematical concepts include section properties (area, moment of inertia, radius of gyration), stress superposition, eccentricity, neutral axis location, and the hyperbolic boundary where stress equals zero. ③Construction uses GeoGebra commands: Polygon to draw the section, Intersect to find load application points, and Textfield for interactive input of eccentricity and load; objects like P_1, b, h, Area, Iy, Iz, iy2, iz2 compute section parameters, while Stress and Compression display the stress field. ④Suitable for university courses in engineering mechanics, mechanics of materials, or structural engineering, and also for high school students exploring analytic geometry and function graphing in applied contexts.
GeoGebra Commands & Parameters
Polygon(A, B, C, D) → Section, a, b_1, c, dIntersect(N, d) → EIntersect(N, b_1) → FPolygon(D, E, F, C) → Compression, d_1, e, f, c_1Intersect(N, c) → GIntersect(N, a) → HPolygon(E, G, D) → poly1, d_2, e_1, gPolygon(G, F, C) → poly2, c_2, g_1, f_1Textfield(b) → InputBox1Textfield(h) → InputBox2Textfield(P_1) → InputBox3Polygon(I, J, M, K) → Yadro, i, j, m, kPolygon(A, H, G, D) → poly3, a_1, h_1, g_2, d_3Polygon(E, A, H) → poly4, h_2, e_2, a_2Polygon(H, B, F) → poly5, f_2, h_3, b_2
AI Drawing Prompt Reference
Draw a rectangular cross-section and indicate the stress distribution under eccentric axial loading. Start by sketching the rectangle, then mark the load application points and depict the compression and tension zones. Use input fields for section dimensions and load magnitude to dynamically show the neutral axis and the hyperbolic boundary where stress is zero. The final image should clearly display the zones of compression and tension.
The prompt above was compiled from the original drawing commands and is for reference only.