
e as the Limit of an Infinite Sum — Dynamic Visualization
Loading the math board and drawing, please wait…
In collections
Geom. & Alg.: Exponential Functions & Logarithms
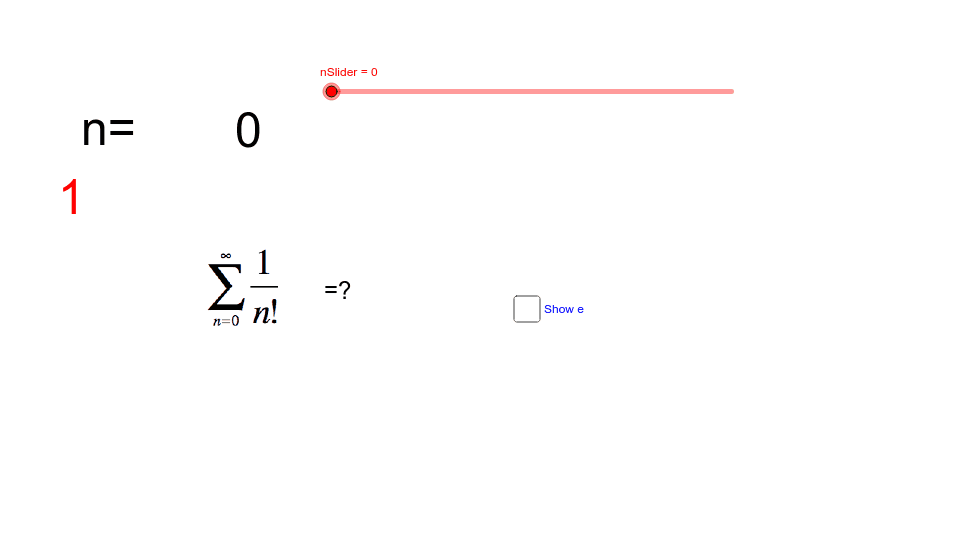
① This GeoGebra example dynamically demonstrates the natural constant e as the limit of an infinite series, showing how partial sums approach e as n increases. ② The core mathematical concepts are the series definition of e: e = Σ_{k=0}^{∞} 1/k!, and the idea of limits of sequences, involving sequences, limits, and infinite summation. ③ Construction highlights: a slider nSlider controls the number of terms, the Sequence command generates the sequence of reciprocal factorials, the Sum command computes partial sums, Text objects display the current sum and its approximation to e, along with images and explanatory text. Objects used include nSlider, n, text3, text4, text5, E, text6, b, text2, A, pic1, B, list1, a, text1. ④ Suitable for high school to early college mathematics, useful for teaching the series representation of e, limit concepts, and numerical approximation methods, and for classroom demonstrations in calculus or sequence topics.
GeoGebra Commands & Parameters
Text(n) → text3Text(E) → text6Sequence(1 / n!, n, 0, nSlider) → list1Sum(list1, nSlider + 1) → aText(a) → text1
AI Drawing Prompt Reference
Create a dynamic visualization of the natural constant e, with a slider nSlider to control the number of terms. Use the Sequence command to generate a sequence of reciprocal factorials from 0 to nSlider, compute the sum of the first n terms, and display the current sum and its approximation to e. Add text to show the current sum and its approximation to e.
The prompt above was compiled from the original drawing commands and is for reference only.