
Dynamic Visualization of Quadratic Function Graphs and Vertex Coordinates
Loading the math board and drawing, please wait…
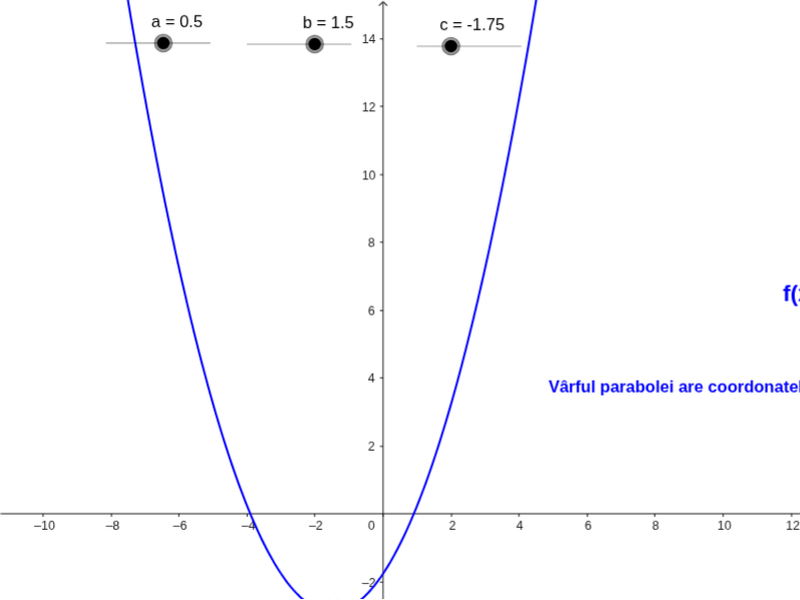
This GeoGebra example demonstrates the graph of a quadratic function f(x)=ax²+bx+c and its key features (vertex, axis of symmetry, discriminant) through dynamic visualization. Core mathematical concepts include the standard form of quadratic functions, vertex coordinate formulas, the discriminant's role in determining x-intercepts, and how parameters a, b, c affect the shape and position of the parabola. Construction highlights: sliders a, b, c control the coefficients; commands compute the vertex x-coordinate x_v, discriminant Δ, and y-coordinate y_v; point V and text objects text1, text2 display the function expression and vertex coordinates. Suitable for middle and high school students learning quadratic function properties and parameter effects, as well as for teachers' classroom demonstrations or students' self-directed exploration.
GeoGebra Commands & Parameters
Numeric a(0.5)Numeric b(1.5)Numeric c(-1.75)f(x) = (a * x^(2)) + (b * x) + c((-b)) / ((2 * a))(a * c)b^(2) - (4 * ac)((-Δ)) / ((4 * a))(x_v, y_v)
AI Drawing Prompt Reference
Draw the graph of a quadratic function f(x)=ax²+bx+c, where a, b, and c are adjustable parameters. Use sliders to control the values of a, b, and c. Display the vertex coordinates V(x_v, y_v) and the discriminant Δ on the graph. The x-coordinate of the vertex x_v is calculated as (-b)/(2a), and the y-coordinate y_v is f(x_v). The discriminant Δ is calculated as b²-4ac. Show the function expression and vertex coordinates on the graph.
The prompt above was compiled from the original drawing commands and is for reference only.