
Dynamic Demonstration of Derivative at a Point for Absolute Value Function
Loading the math board and drawing, please wait…
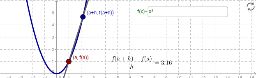
This GeoGebra example dynamically illustrates the derivative of an absolute value function at a specific point using a movable red dot and an adjustable step size h. The core mathematical concept is the limit definition of the derivative (difference quotient) and the non-differentiability of the absolute value function at its cusp. Construction details: the Point command creates the draggable red point A, Line draws the secant line, Textfield and inputBox1 provide an input box for changing h, slider b controls the point location, object f represents the absolute value function, and auxiliary objects a and B compute the difference quotient. Suitable for high school or introductory college calculus students, this applet helps visualize how the secant line approaches the tangent line as h approaches zero, and why the derivative does not exist at the vertex of the absolute value graph. By moving the red dot and varying h, learners can observe changes in the secant slope, reinforcing the geometric meaning of the derivative and the concept of limits.
GeoGebra Commands & Parameters
Point(f) → ALine(B, A) → aTextfield(f) → inputBox1
AI Drawing Prompt Reference
Draw a dynamic demonstration of an absolute value function with a draggable red point A representing a point on the function, a line a passing through point A and another point B on the function, and an input box to adjust the step size h. By moving point A and changing h, observe the change in the slope of the secant line to understand the concept of derivatives.
The prompt above was compiled from the original drawing commands and is for reference only.