
Definition of the Derivative (Dynamic Visualization)
Loading the math board and drawing, please wait…
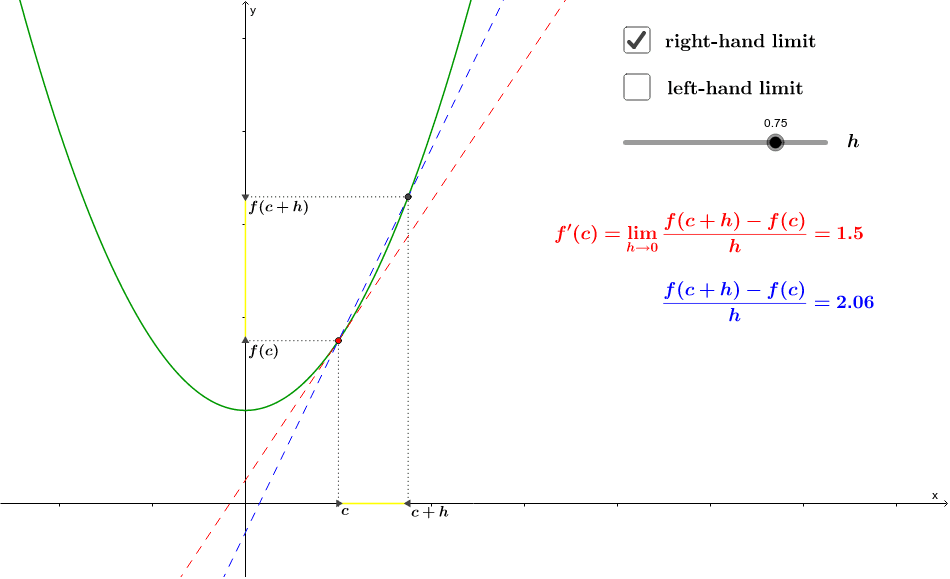
This GeoGebra example dynamically illustrates the definition of the derivative by showing how a secant line through a point on a function graph approaches the tangent line as the increment h tends to zero. The core mathematical concept is the limit definition of the derivative: the slope of the tangent line as the limit of the secant slope. Construction details include using the Segment command to create secant lines, the If command for conditional logic, and objects such as the function f, moving point P, increment h, secant line, tangent line, and multiple text objects (text1 to text7) displaying values and formulas. Suitable for high school and introductory college calculus students to grasp the geometric meaning of derivatives, and useful for classroom demonstrations.
GeoGebra Commands & Parameters
Segment(P, (x(P), 0)) → bSegment(P, (0, y(P))) → dSegment(Q, (x(Q), 0)) → gSegment(Q, (0, y(Q))) → iSegment((x(P), 0), (x(Q), 0)) → jSegment((0, y(P)), (0, y(Q))) → kIf(R, 0, -1) → AIf(R, 1, 0) → B
AI Drawing Prompt Reference
Draw a graph of a function with a movable point on it. From this point, draw dashed perpendicular segments to the x-axis and y-axis. Add a second point, also with perpendicular segments to both axes. Connect the foot points on the x-axis with a horizontal segment, and the foot points on the y-axis with a vertical segment. Draw a secant line through the two points, and show a tangent line as the limiting position of the secant. Include a slider for the increment value, and several text labels displaying function values, secant slope, tangent slope, and the derivative definition formula. The visualization aims to illustrate the geometric meaning of the derivative as the limit of secant slopes.
The prompt above was compiled from the original drawing commands and is for reference only.