
Dynamic Changes in Quadratic Function Graphs
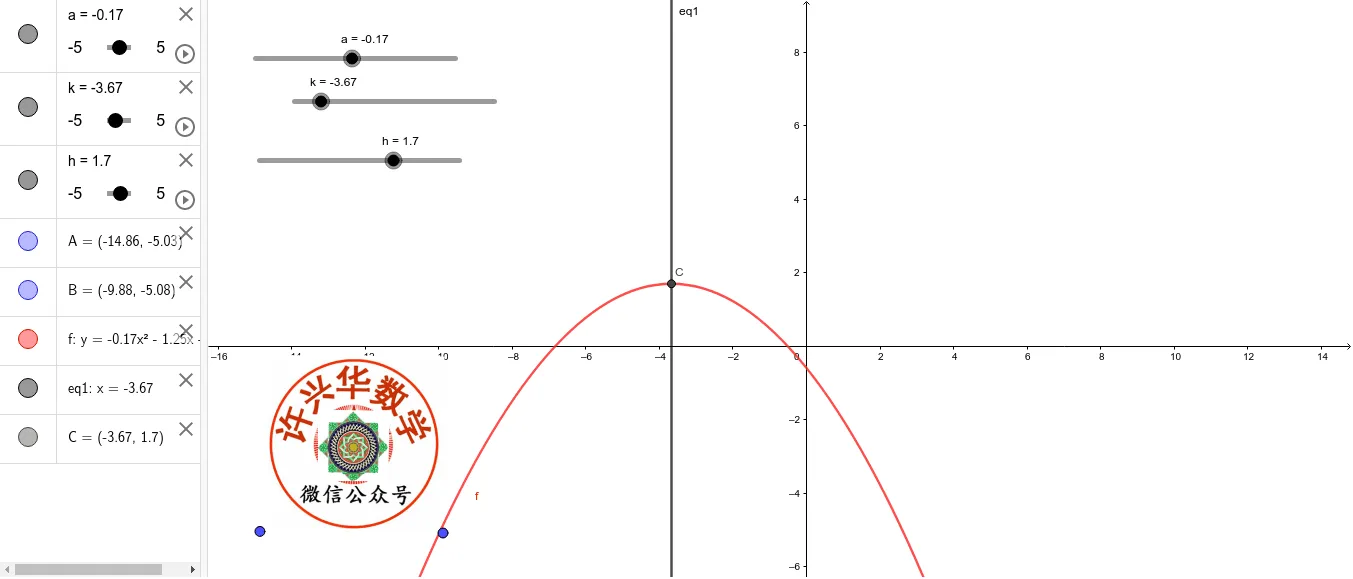
This example demonstrates the dynamic changes in quadratic function graphs as parameters vary. Key mathematical concepts include quadratic functions, addition, and inequalities. Using GeoGebra commands such as Intersect, objects a, k, h, A, B, pic1, f, eq1, and C, one can observe the changes in the quadratic function graph intuitively. Suitable for high school mathematics education and learning the properties of quadratic functions.
Loading the math board and drawing, please wait…