
Dunearn Modulus Function Graph Introduction
Loading the math board and drawing, please wait…
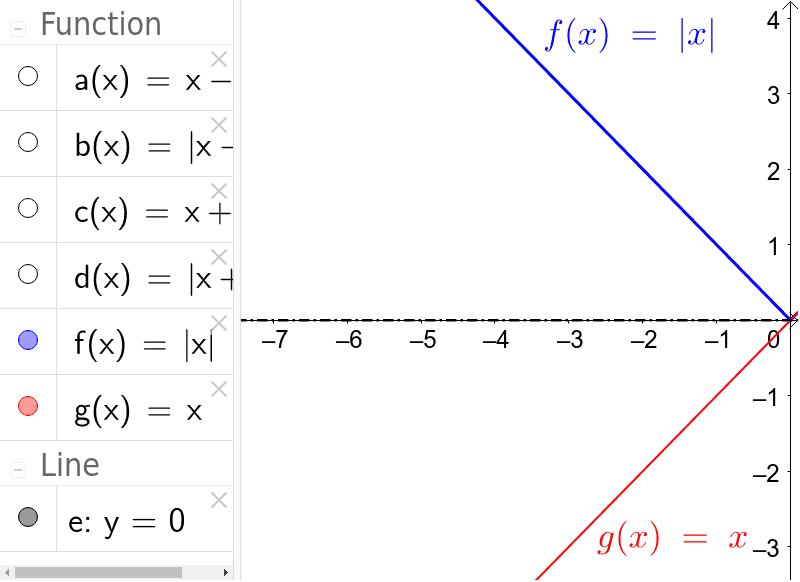
This example demonstrates the plotting of modulus function graphs. Key mathematical concepts include modulus functions, periodicity, and function graph transformations. Construction involves GeoGebra commands f, g, a, b, c, d, e. Suitable for high school students learning about function graphs and periodic phenomena.
GeoGebra Commands & Parameters
f(x) = abs(x)g(x) = xa(x) = x - 3b(x) = abs(x - 3)c(x) = x + 3d(x) = abs(x + 3)Line e(0.0, 1.0, 0.0)
AI Drawing Prompt Reference
Draw a graph demonstrating modulus function plots, including a basic absolute value function and its translations. Start by plotting the basic absolute value function, then plot the function shifted left by 3 units and right by 3 units. Finally, add a horizontal line passing through the point (0,1) to show the translation and periodicity of the function graphs.
The prompt above was compiled from the original drawing commands and is for reference only.