
Double Number Line – Percent Change
Loading the math board and drawing, please wait…
In collections
Percent Change App Collection
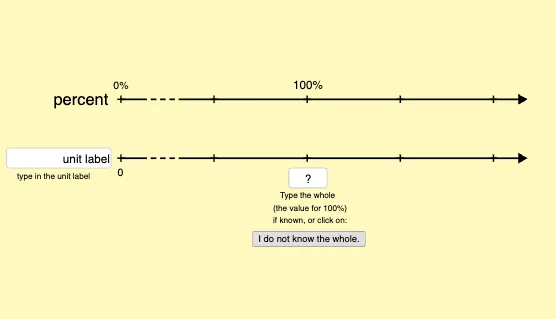
This example uses a double number line to model percent change contexts. Key mathematical concepts include percentages, ratios, and value adjustments. Dynamic visualizations are achieved using GeoGebra commands such as If, Point, Segment, Textfield, etc. Suitable for middle school and above students to learn about percentage and ratio calculations.
GeoGebra Commands & Parameters
If(q1changeValue ≥ 0 ∧ q1changeValue ≤ 0.1, 0.1, If[q1changeValue < 25, round((100 * q1changeValue)) / 100, If[q1changeValue < 75, round((10 * q1changeValue)) / 10, If[q1changeValue > 100, 100, round(q1changeValue)]]]) → q1changeValueRndIf(q1 ≥ 0 ∧ q1 ≤ 0.1, 0.1, If[q1 < 25, round((100 * q1)) / 100, If[q1 < 75, round((10 * q1)) / 10, If[q1 > 100, 100, round(q1)]]]) → q1rndIf(q2 < 500, 100, If[q2 < 1000, 10, 1]) → roundingFactorDNL2valuesIf(q2 ≥ 0 ∧ q2 ≤ 0.1, 0.1, round((roundingFactorDNL2values * q2)) / roundingFactorDNL2values) → q2rndPoint(Segment[(0, 0.85), (4.3, 0.85)]) → SlidePtIf(q1 < 500, 100, If[q1 < 1000, 10, 1]) → roundingFactorDNL1valuesSegment(A, DNL2ArrowPt) → lineDNL1Segment(B, DNL1ArrowPt) → lineDNL2Textfield(q1labelForLengthAlwaysShow) → q1blabelInputTextfield(q2labelForLengthAlwaysShow) → q2blabelInputTextfield(q1) → q1avalueInputText("0%", (x(B) - 0.08, y(B) + yOffSet)) → zeroDNL1Text("0", (x(A) - 0.035, y(A) - (1.7 * yOffSet))) → zeroDNL2Segment((3, h), (3, h + 1)) → startSegPercentValueIncrSegment((2.5, h + 1), (2.5, h + 1.2)) → startSegPercentIncrSequence(Segment[(k, -0.02), (k, h + 0.02)], k, 0.3, 0.6, 0.1) → startSelectDNLGapDashedSegment((1.5, -1.6), (1.5, h + 1.6)) → startSegPercentDecrVector(((2 * length) - 0.25, (0.3 * h)), ((2 * length) - 0.9, (0.3 * h))) → startVectorDecrButtonVector(((2 * length) + 0.25, (0.3 * h)), ((2 * length) + 0.9, (0.3 * h))) → startVectorIncrButtonIf(q2changeValue ≥ 0 ∧ q2changeValue ≤ 0.1, 0.1, If[q2changeValue < 25, round((100 * q2changeValue)) / 100, If[q2changeValue < 75, round((10 * q2changeValue)) / 10, round(q2changeValue)]]) → q2changeValueRndSegment(SlidePt + (0, h + 0.9), SlidePt - (0, h + 0.9)) → slideSegTextfield(locationXq1InputTextToParse) → locationXq1InputTextfield(locationXq2InputTextToParse) → locationXq2InputTextfield(q2inputTextToParse) → q2avalueInputTextfield(q2inputTextToParse) → q2valueInputStartTextfield(q2changeValueTextToParse) → startDecrAmtInputTextfield(q2decrIntervalTextToParse) → startDecrAmtIntervalInputTextfield(q1changeValueTextToParse) → startDecrPercentInputTextfield(q1decrIntervalTextToParse) → startDecrPercentIntervalInputTextfield(q2changeValueTextToParse) → startIncrAmtInputTextfield(q2incrIntervalTextToParse) → startIncrAmtIntervalInputTextfield(q1changeValueTextToParse) → startIncrPercentInputTextfield(q1incrIntervalTextToParse) → startIncrPercentIntervalInputSequence((k, h), k, 0, 4.3, ((2 * length)) / hatchMinor) → hashMinorDNL1Sequence((k, 0), k, 0, 4.3, ((2 * length)) / hatchMinor) → hashMinorDNL2Vector(((If[decrCk, 1.5, 2.5] * length), If[amtCk, -1.9, h + 1.88]), ((If[decrCk, 1, 3] * length), If[amtCk, -1.9, h + 1.88])) → startDecrIncrVector1Vector(((If[decrCk, 1, 1.5] * If[amtCk, (1.5 * length), (1.8 * length)]), If[amtCk, -1.9, h + 1.88]), ((2 * length), If[amtCk, -1.9, h + 1.88])) → startDecrIncrVector2Vector(((2 * length), h + 1.085), ((q1changeValue / ((50 * zoom)) * length), h + 1.085)) → dnlIntervalVector2Segment(((2 * length), If[dnlCk ∧ showAmtIntervalCk ∧ (¬showPercentIntervalCk), -1, If[amtCk ∧ (¬dnlCk), -2, If[showAmtCk ∧ (¬showPercentIntervalCk), -0.93, If[dnlCk, h + 1.2, h + 2]]]]), ((2 * length), If[dnlCk ∧ showAmtCk ∧ showPercentCk, -1.3, If[showAmtIntervalCk ∧ showPercentIntervalCk, -1, If[(¬dnlCk) ∧ showPercentIntervalCk, h + 1.2, If[(¬dnlCk) ∧ (¬showPercentCk) ∧ (¬showPercentIntervalCk) ∧ (¬amtCk) ∧ (¬startCk2), 0, If[(¬dnlCk) ∧ amtCk, h, (0.5 * h)]]]]])) → segAt100percentSequence(((length * k), h), k, 0, 4, 1) → hashMajorDNL1Sequence(((length * k), 0), k, 0, 4, 1) → hashMajorDNL2Sequence(Text[((0.5 * p) * q2), ((length * p) + xOffSet, y(A) - (1.7 * yOffSet))], p, If[addHashMarksCk ∧ (hatchMinor ≟ 7 ∨ hatchMinor ≟ 9), 6 / hatchMinor, If[addHashMarksCk ∧ hatchMinor ≤ 5, 2 / hatchMinor, 4 / If[addHashMarksCk, hatchMinor, 4]]], 4, If[addHashMarksCk ∧ (hatchMinor ≟ 7 ∨ hatchMinor ≟ 9), 6 / hatchMinor, If[addHashMarksCk ∧ hatchMinor ≤ 5, 2 / hatchMinor, 4 / If[addHashMarksCk, hatchMinor, 4]]]) → hashMarkValuesTextDNL2Sequence(Text[(50 * q) + "%", ((length * q) + topxOffSet, y(B) + yOffSet)], q, If[addHashMarksCk ∧ (hatchMinor ≟ 7 ∨ hatchMinor ≟ 9), 6 / hatchMinor, If[addHashMarksCk ∧ hatchMinor ≤ 5, 2 / hatchMinor, 4 / If[addHashMarksCk, hatchMinor, 4]]], If[addHashMarksCk ∧ (hatchMinor ≟ 3 ∨ hatchMinor ≟ 6 ∨ hatchMinor ≟ 9), 3.5, 4], If[addHashMarksCk ∧ (hatchMinor ≟ 7 ∨ hatchMinor ≟ 9), 6 / hatchMinor, If[addHashMarksCk ∧ hatchMinor ≤ 5, 2 / hatchMinor, 4 / If[addHashMarksCk, hatchMinor, 4]]]) → hashMarkValuesTextDNL1If(dnlCk, Segment[((q1changeValue / ((50 * zoom)) * length), If[showAmtCk, -1.3, If[showAmtIntervalCk ∧ (¬showPercentIntervalCk) ∧ (¬showPercentCk), h + 0.2, h + 1.2]]), ((q1changeValue / ((50 * zoom)) * length), If[showAmtCk ∧ (showPercentCk ∨ showPercentIntervalCk), 3, If[showAmtCk, h + 0.2, If[showAmtIntervalCk, -1, -0.15]]])], Segment[((If[decrCk, 1, 3] * length), If[(¬dnlCk) ∧ showPercentIntervalCk, h + 1.2, If[(¬dnlCk) ∧ showPercentCk, h + 0.6, (0.5 * h)]]), ((If[decrCk, 1, 3] * length), If[amtCk, -2, h + 2])]) → segIncrDecrVector(((2 * length), If[showAmtIntervalCk, -0.85, h + 1.085]), (If[¬dnlCk, If[decrCk, length, (3 * length)], (q1changeValue / ((50 * zoom)) * length)], If[showAmtIntervalCk, -0.85, h + 1.085])) → dnlIntervalVector
AI Drawing Prompt Reference
Draw two parallel number lines to represent percent change. The first line should be labeled from 0% to 100%, and the second from 0 to 1000. Dynamically display percentage changes on the first line based on input values, with corresponding numerical changes on the second line. Use dashed lines and minor ticks to mark value intervals, and label the values next to the axes. Include buttons and sliders to adjust values and percentage changes, updating both number lines in real time.
The prompt above was compiled from the original drawing commands and is for reference only.