
Dot Plot Tool: Visualize Data Distribution with Mean and Median
Loading the math board and drawing, please wait…
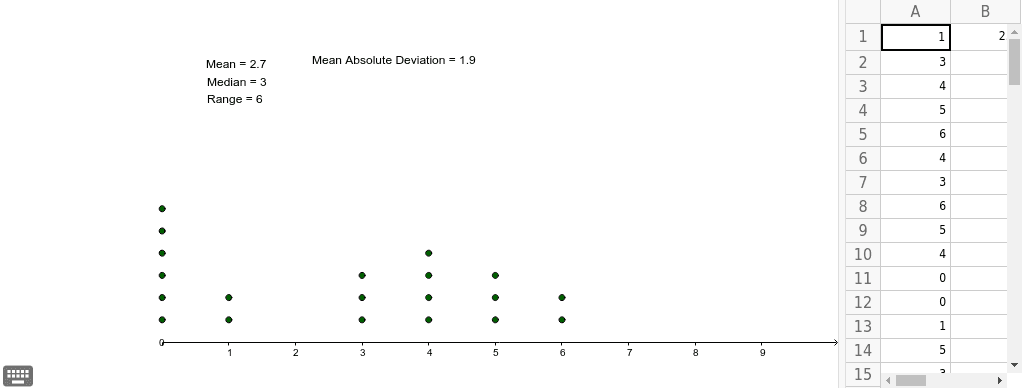
This example demonstrates a Dot Plot tool capable of visualizing up to 30 data values. It covers core statistical concepts including mean and median calculations. Construction utilizes GeoGebra commands like DotPlot, Mean, and Median alongside list objects such as list1 for data storage. Suitable for middle school statistics education or data analysis practice, allowing users to explore data distribution visually and compute key statistical measures dynamically.
GeoGebra Commands & Parameters
DotPlot(A1:A20) → list1Mean(A1:A20) → B1Median(A1:A20) → aMedian(A1:A20) → bMedian(A1:A20) → cMedian(A1:A20) → C1Mean(F1:F20) → G1
AI Drawing Prompt Reference
Draw a histogram or bar chart showing the distribution of up to 30 data points. The chart should include bars representing each data point, with heights reflecting the data values. Also, label the mean and median clearly. The data points can be randomly generated. The order of construction is to first create the data points, then draw the bars, and finally add the statistical measures.
The prompt above was compiled from the original drawing commands and is for reference only.