
Dot Plot Maker
Loading the math board and drawing, please wait…
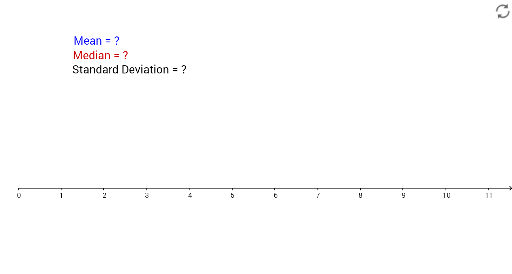
This example demonstrates how to use a dot plot tool to create a plot with up to 30 values, involving core math concepts like arithmetic mean, standard deviation, geometry, linear programming, and stochastic processes. It constructs median, mean, length, standard deviation, and dot plot using GeoGebra commands, suitable for high school and above mathematics education and data analysis beginners.
GeoGebra Commands & Parameters
Median(A1:A20) → aMedian(A1:A20) → bMedian(A1:A20) → cMean(F1:F20) → J1Mean(H3:H3) → dLength(F1:F1) → K1Mean(A1:A50) → F1Median(A1:A50) → F2SD(A1:A50) → F3DotPlot(C1:C1) → ADotPlot(C2:C2) → MedianDotPlot(A1:A50) → list1
AI Drawing Prompt Reference
Create a dot plot with 30 data points and calculate and display the median, mean, and standard deviation. Also, create another dot plot with 50 data points and calculate its median and mean.
The prompt above was compiled from the original drawing commands and is for reference only.