
Dividing Neighborhoods: Polygon Region Construction and Optimization
Loading the math board and drawing, please wait…
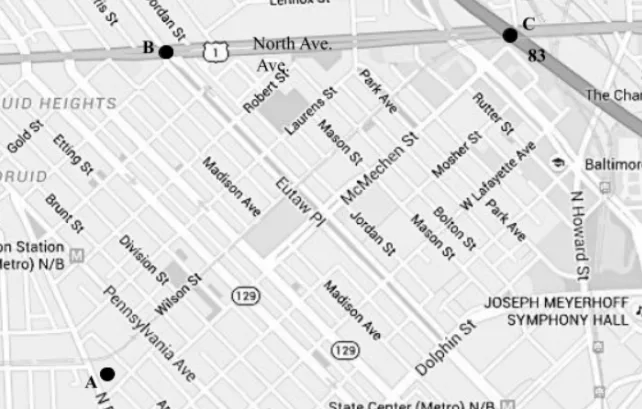
This example demonstrates how to use GeoGebra geometric tools to divide regions into smaller sections, construct polygon grids, and explore their mathematical properties. The core mathematical concepts include polygon area division, coordinate representation of ellipses, periodic characteristics of cosine functions, and strategies for solving optimization problems. Construction details: Using point objects A and B as control points, combining image pic1 for region segmentation, creating polygon grids with the polygon tool, drawing boundary curves with ellipse commands, and adjusting region shapes using cosine functions. Suitable for middle and high school mathematics courses covering geometric construction, coordinate geometry, trigonometry, and optimization topics, as well as comprehensive visualization of plane geometry and algebraic problems in mathematical competitions.
GeoGebra Commands & Parameters
Point A(-5.116, -3.012)Point B(4.9784, -3.012)
AI Drawing Prompt Reference
Draw a rectangular region defined by two points A and B. Point A is at (-5.116, -3.012) and point B is at (4.9784, -3.012). Draw a horizontal line segment from A to B, then vertical lines from both ends to form a rectangle. Inside the rectangle, draw some elliptical curves and adjust their shapes using cosine functions. Finally, show the layout of the rectangle and the internal elliptical curves.
The prompt above was compiled from the original drawing commands and is for reference only.