
Distinguishing Two Types of Situations Example
Loading the math board and drawing, please wait…
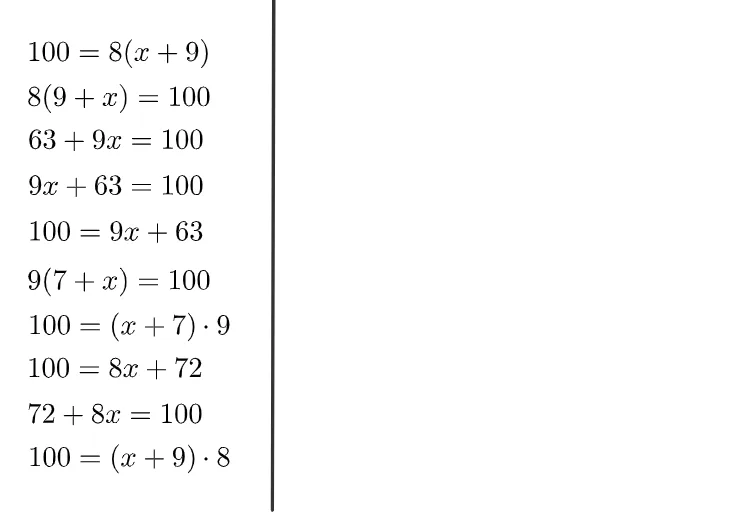
This example demonstrates how to use GeoGebra to visualize and distinguish between two different mathematical scenarios. Core concepts include Binomial Distribution, Curve Sketching, Standard Deviation, and Geometric Distribution. Construction involves commands like Segment and multiple objects such as text1 to text10, points A and B, and function f. Suitable for middle school and above, focusing on probability statistics and function graphing education.
GeoGebra Commands & Parameters
Segment(A, B) → f
AI Drawing Prompt Reference
Draw a horizontal segment connecting a left point to a right point as the base. Above or near this segment, add a function curve that reflects characteristics of binomial or geometric distribution, such as step-like or discrete point trends. Place multiple text labels around the segment to distinguish two different mathematical scenarios, each label indicating a value or description. The overall layout should clearly show the relationship between probability statistics and function graphing, suitable for middle school and above to understand differences in standard deviation and distribution shapes.
The prompt above was compiled from the original drawing commands and is for reference only.